It was a trending day for the markets as the key indices ended the day on a decently positive note. The markets opened on a negative note. This led to a negative opening of the Nifty index. It marked its low in the early minutes of the session and then slowly crawled inside the positive zone. The Nifty traded flat until afternoon, after which a strong trend emerged. NIFTY went on to cross 19700 levels and while maintaining its gains, it closed with a ngain of 116 points (+0.59%).
While PSU banks continue to relatively outperform the broader markets, the financial services and private banking space is showing some improvement in relative performance. This private bank stock looks ready to break out from sideways consolidation.
INDUSINDBK tested its high point at Rs. 1,440 in July. Since then, it appears to be trading in a sideways trajectory over the past couple of weeks. This consolidation has led to the formation of a rectangle. The oscillation of the price at Rs. 1,365-1,440 levels has constantly seen the price taking support at the 50-DMA. The 50-DMA currently stands at 1397.
The stock has just tested the upper edge of this formation and looks ready for a breakout. The price has closed near its high point. Any sustenance above 1440 will infuse fresh momentum into the stock.
The RSI has marked a new 14-period high, which is bullish. It is also seen sporting a mild bullish divergence against the price. The MACD has shown a positive crossover; it stays in a continuing buy mode and trades above the signal line.
The OBV remains near its high point. This indicates accumulation in the stock near the present levels and within the consolidation zone. The stock sits on the verge of entering inside the improving quadrant of the RRG.
A breakout in the expected manner can lead the stock higher to test Rs. 1,500 levels. Any close below Rs. 1,395 should be treated as a stop-loss for this trade.
Milan Vaishnav, CMT, MSTA, is a Technical Analyst
head: Breakout from resistance gives large-cap space for rise
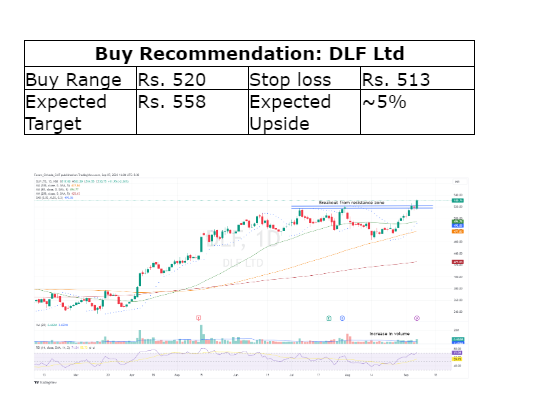
This large-cap real estate stock has broken out from a resistance zone by crossing above the horizontal trendlines representing this area. This breakout can trigger a potential up-move in the stock by close to 5%, thus, making the current levels attractive to buy with a favorable risk-reward ratio.

After forming a bottom near Rs. 340-342 levels in March, the stock price of DLF Ltd (DLF) witnessed a rebound and has stayed in an uptrend. While moving higher, the stock crossed the multiple moving averages of 50-day, 100-day, and 200-day MA, indicating the underlying trend to be bullish.
This up-move in price halted near the Rs. 517-520 level in July and experienced a corrective decline as the level of Rs. 520 acted as a resistance.
The price decline took support near 470 levels, which coincided with 100-day MA and showed signs of resumption. Recently, the stock price made a breakout from this resistance level which invites buying opportunities.
This price breakout has been backed by an increase in volume, supporting bullishness.
The PSAR continues to remain in buy mode.
Thus, the formation of higher tops and higher bottoms, price breakout from the resistance level, an increase in volume, and PSAR in buy mode lay the ground for a potential up-move in the stock price by close to 5%. Any price move below Rs. 513 can be considered to move out of the stock.
Foram Chheda, CMT, is a Technical Research Analyst


