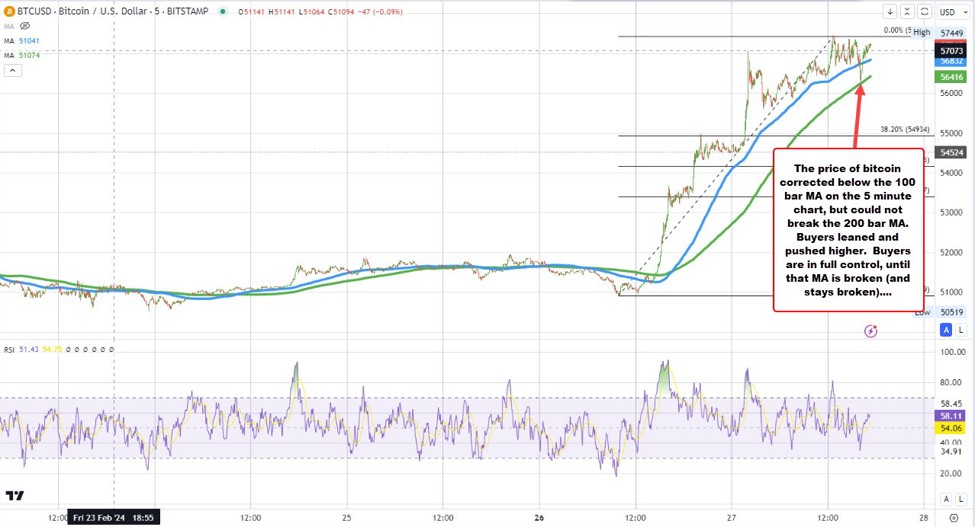
The price of bitcoin is hot. It is red hot. From the low yesterday at $40,900, the price has moved to a high today of $57,449. That is a pretty healthy move in a short period of time.
Looking the RSI, it is higher and in overbought conditions. The RSI is even diverging. So is it time to sell.
Well, looking at the daily chart, there isn’t a level to lean against until probably near $60000.
Drilling to the hourly chart, the run higher has run away from my favored 100 and 200 hour MAs. RSIs are also diverging but there is nothing to show, “it is time to sell”.
To find a level, I have to drill to the 5 minute chart. On that chart, the price has moved below the 100 bar MA on that chart intraday today, BUT stalled just ahead of the 200 bar MA on the same chart. Until the price goes below that MA (and stays below), the sellers should stay away. The buyers remain in full control.
Don’t fall for too hot. Things can always get hotter. Wait for the market price and technicals to show you the way.
Learn all about it, by watching the video above….
Bitcoin corrected today, but held support at the 200 bar MA


