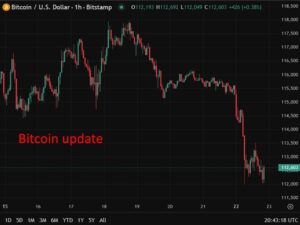
- Bitcoin ↓ over 15% in April
- Crypto hit by “higher for longer” stance
- 261.8 Fibonacci level key reference point
- RSI signals that prices are near oversold
Could the party already be over for Bitcoin bulls?
Well, the “OG” crypto ended April over 15% lower despite the infamous halving event almost two weeks ago.
Investor appetite for Bitcoin has been hit by the prospects of “higher for longer” US interest rates with ETF outflows feeding bears further. According to Bloomberg, a group of almost a dozen US spot Bitcoin ETFs saw net outflows of $182 million in April.
Since the launch of Bitcoin ETFs in January 2024, we may have entered a phase in the crypto currency’s evolution where it responds more to economic data releases, especially from the U.S.
Market participants will today have their attention turned towards the U.S Federal Reserve rate decision this evening which is expected to conclude with rates left unchanged at 5.5%.
So, attention will be directed towards the policy statement and comments from Federal Reserve Chair Jerome Powell for fresh clues on the central bank’s next move.
And that’s not all…
Friday’s US jobs data promises to rock this crypto as investors are looking to see data continue to show strength in the US labor market.
- Average Hourly Earnings: est. 0.3%
- Unemployment rate: est. 3.8%
- Non-Farm Employment Change: est 240k
Note: Traders are currently pricing in a 75% probability of a 25-basis point cut by November with a move fully priced in for December.
Bitcoin has already shed roughly 6% today and may extend losses if the Fed strikes a hawkish stance.
From an Elliot Wave perspective, Bitcoin is in a correction phase following its year-to-date high of $73850, which marked the end of wave 5.
It has since been confined within a downward-sloping channel, later morphing into a falling wedge.
While putting this article together, Bitcoin is piercing through the downward-sloping support line. A break will only be confirmed if we have the current daily candle stick close below the support line.
A break of the lower downward sloping line (support) which has acted as a demand zone since March 5th, 2024, may see Bitcoin bears (those looking to see the cryptocurrency decline further) set their sights on the following near-term support levels.
-
58054.45: The 261.8 Fibonacci level
-
54969.63: An important price value
-
50000: A psychologically important round number
The Fibonacci level is taken from the November 21st low of 15475.50 to the July 13th, 2023, high of 31789.20.
On the other hand, Bitcoin bulls, (those looking to see the cryptocurrency rally), may have their eyes set on the following near-term resistance levels.
-
58054.45: The 261.8 Fibonacci level
-
59423.42: The downward-sloping trendline of the falling wedge
-
63575.67: The upper resistance of the downward-sloping channel
When considering the Relative strength index, – an indicator that identifies overbought (too many buyers) and oversold zones (too many sellers), It is worth noting that Bitcoin is flirting with the oversold level


