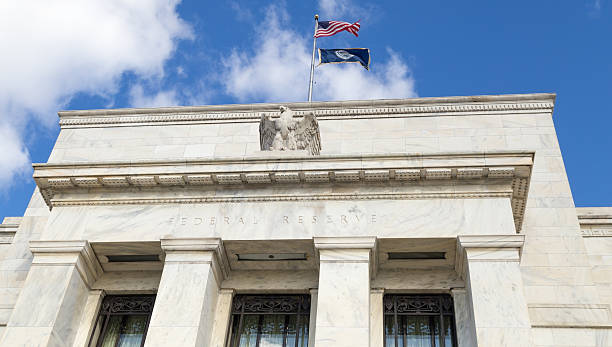
- The market anticipates a shift in the Fed’s stance, with three rate cuts now expected in 2024 due to softening economic data.
- A soft landing remains possible as the labor market cools and inflation shows signs of easing.
- Technical analysis suggests GBP/USD is consolidating, EUR/USD maintains a bullish structure, and the Dollar Index (DXY) is at risk of a sharp decline.
FOMC Preview: September Cut Most Likely
Market participants are approaching today’s FOMC meeting with numerous questions. The previous FOMC meeting was bullish for the US dollar as the Fed updated its projections to include one rate cut in 2024.
Since the June meeting, however, economic data has painted a very different picture. The recent changes and softening data in the US have significantly altered the landscape, with markets now pricing in three rate cuts for 2024.
A soft landing remains possible for the US as the labor market continues to cool. Unemployment has already reached 4.1% in June, exceeding the forecasted 4% predicted for the end of 2024.
Regarding inflation, both core CPI and the core PCE deflator were alarmingly high in the first quarter. However, the numbers for May and June appear more promising. Most notably, the “super-core services” excluding housing, food, and energy—that the Fed has heavily emphasized have slowed significantly. Additionally, the key housing components are now reflecting the moderation observed in third-party private rent series.
US Rates and Inflation Chart, July 31, 2024

Source: LSEG (click to enlarge)
This creates a slight dilemma for the Fed, as rising unemployment could heighten recession concerns. With income growth slowing and pandemic-era savings depleting, the Fed may be pushed to implement the three rate cuts currently anticipated before the year’s end.
Given this dilemma and the multitude of factors the Fed must consider, today’s forward guidance will be crucial. The rhetoric in June about one rate cut in 2024 is likely to change. If Fed Chair Powell maintains his outlook, it could lead to a short-term bounce for the US dollar.
Conversely, a pivot from Powell and a more bearish tone would theoretically lead to US dollar weakness. However, the recent selloff in the US dollar may indicate that much of the “pivot” is already priced in.
Technical Analysis
GBP/USD
From a technical perspective, GBP/USD has been consolidating over the past three days since hitting support at 1.2850. Both bulls and bears have attempted to move the price away from this level, but each effort has been countered by buying or selling pressure. This underscores the current uncertainty surrounding the upcoming Central Bank meetings.
Immediate support below the 1.2850 area lies at the 1.2800 and 1.2750 levels. A break below these support zones could shift focus back to the psychological 1.2500 mark. Conversely, an upward movement will face resistance at 1.2950 before the psychological 1.3000 level becomes crucial again.
Support
Resistance
GBP/USD Daily Chart, July 31, 2024

Source: TradingView (click to enlarge)
EUR/USD
From a technical perspective, EUR/USD has risen today following a slight uptick in the Euro Area’s inflation print.
On a broader scale and daily timeframe, EUR/USD maintains a bullish structure. A daily candle close below the 1.0680 level would be necessary to alter this structure. The 100-day moving average around the 1.0800 level is currently providing support, with immediate resistance at 1.0860 and 1.0900.
Conversely, a decline from the current price may find support at 1.0755 before the key swing low at 1.0680 comes into focus.
EUR/USD Daily Chart, July 31, 2024

Source: TradingView (click to enlarge)
Support
Resistance
US Dollar Index
The Dollar Index (DXY) is at risk of a sharp decline following the FOMC meeting, with much depending on the Fed’s rhetoric. However, the technical outlook appears concerning.
After breaking the long-term ascending trendline, the DXY experienced some consolidation and a brief retracement earlier in the week. As the FOMC meeting approaches, the selloff has resumed.
The DXY is currently breaking through support at the 104.00 level, with further support found at the recent lows of 103.65. Should it break lower, the 103.00 level comes into focus.
Conversely, a move higher from this point faces immediate resistance at 104.313, followed by the resistance level at 104.88 (100-day moving average), which is just below the psychological 105.00 mark.
US Dollar Index Daily Chart, July 31, 2024

Source: TradingView (click to enlarge)


