TradingView has added a new type of chart to help its users better understand the dynamics of trading volume — Session volume profile.
Session volume profile (SVP) calculates volume data within a specified session or sub-session, allowing traders to analyze the intraday volume activity of one specific part of the session.
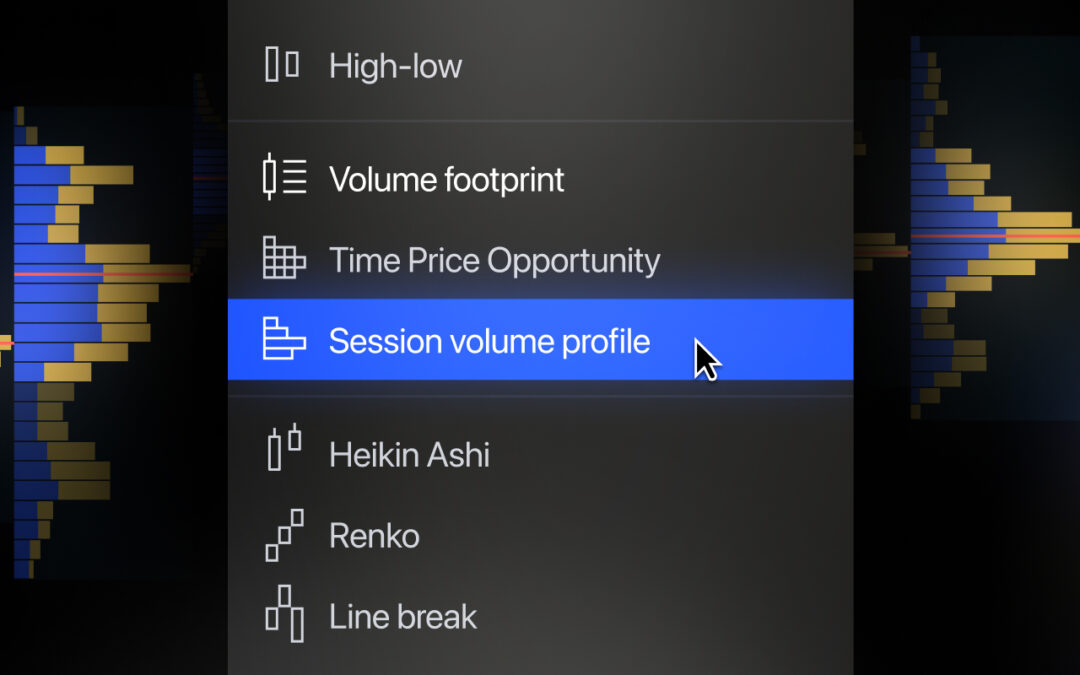
You can select the new chart type from the drop-down menu on the top panel of the chart.
The chart shows volume histograms for the specified sessions, sub-sessions, or time intervals set in the settings.
You can change the parameters and styles of the chart in the Chart Settings menu on the Symbol tab. To make things even easier to use, the settings are presented in groups:
In the Volume profile section, you can enable the display of values on histogram columns, adjust the width of the area for columns, and the colors of the histogram.
In the Lines section, you can activate lines such as POC, VAH, VAL, developing POC, and developing VA.
You can set up a session in the Inputs section where the volume, line placement, and level size will be displayed.
The Session volume profile chart type is available to all users with an Essential subscription or higher.
TradingView has recently expanded the variety of chart types available to its users. In July, it introduced a new Percentage (LTP) calculation type for Renko, Kagi, and Point and Figure (PnF) chart types. In May, it added Volume footprint to the lineup of chart types.


