TradingView is introducing one of the most historically requested features: tick charts (in beta).
Tick charts allow you to build bars based on a defined number of transactions rather than fixed time intervals. Each bar on such a chart represents a set number of successive ticks, irrespective of the elapsed time, which offers a granular view of market activity.
Due to this construction logic, tick charts can give a clearer view of when the market is most active or barely moving. Additionally, they provide a more detailed perspective of price action, trends, and trading volume, which helps to facilitate faster trading decisions.
When trading during highly volatile times, tick bars provide enhanced visualization of trading actions in the market compared to time-based charts.
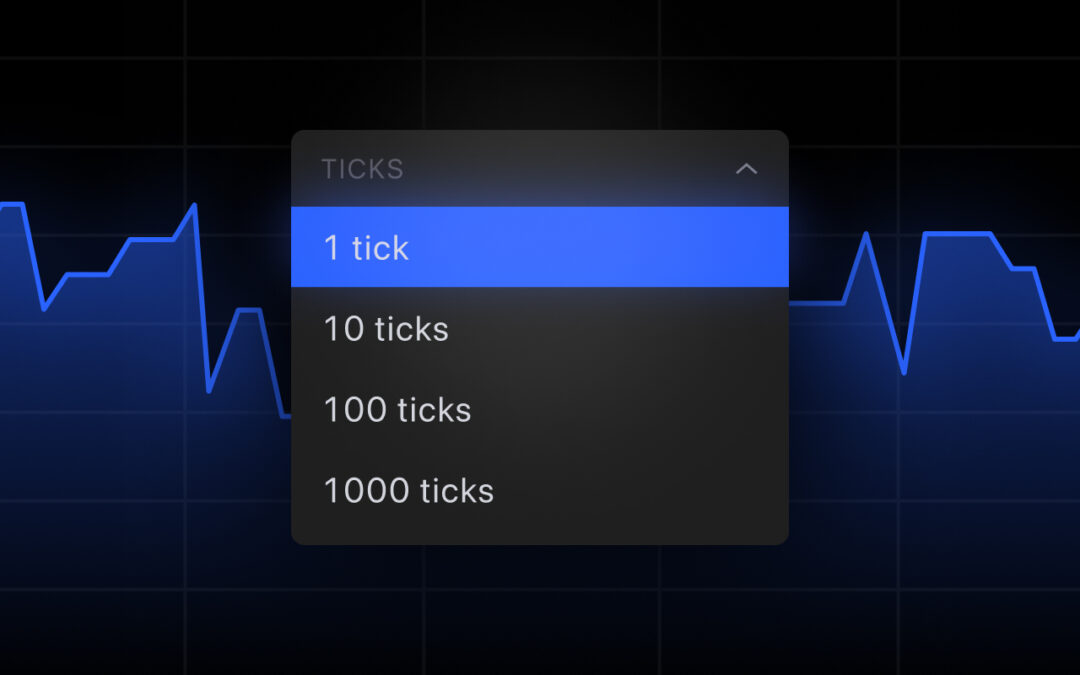
If you have one of the Professional-tier plans – Expert, Elite, or Ultimate – you can try ticks right now. At the moment, there are four intervals to choose from: 1T, 10T, 100T, and 1000T. To open a tick chart, either type the interval on your keyboard while you have the chart open, or select the desired tick-based interval from the Time interval dropdown.
Please note that not all exchanges have tick data at the moment.
The feature is currently in Beta, so TradingView would be extra grateful for your feedback and suggestions.


 Surges Amid Federal Reserve Rate Cut and Market Volatility 5")

