Electronic trading major Interactive Brokers has unveiled a raft of charting enhancements in the latest beta release of its IBKR Desktop platform.
Now you can easily compare multiple symbols directly on a single chart. With the Symbol Comparison feature, add multiple assets to the same chart to analyze relative performance, correlation, and trend patterns.
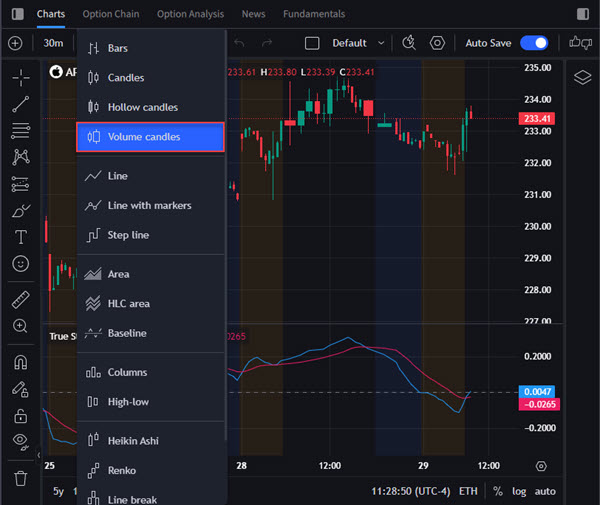
Introducing Volume Candles, an innovative way to visualize market activity. Unlike traditional candlestick charts based solely on time, Volume Candles reflect price movements relative to traded volume. This feature provides a clearer view of where the most significant trading activity takes place, helping you identify true levels of support and resistance and gain insights into price action backed by volume strength.


- Customizable Date Range on the Chart
You can now choose a specific date on the chart or go to a custom date range.
Hot news icon displays the latest news stories relevant to the specific symbol shown on your chart.
The latest (beta) release of the platform also adds a raft of indicators, including Volume Profile Fixed Range and Correlation Coefficient.


