The Reserve Bank of India (RBI) reported that net foreign direct investment (FDI) flows into India dropped 62% over the last fiscal year to USD 10.6 bn in FY24, the lowest since 2007.
It cites that out of the gross FDI inflow of USD 70.9 bn, foreign companies repatriated or disinvested 63% or USD 44.4 bn. Indian companies made investments worth USD 16bn.
While the contraction in net FDI flows (net FDI inflows by foreign companies less net FDI by Indian companies) is significant, RBI also reports that FDI companies saw 45.2% growth in net profit at USD 32.4bn in FY24 and similar growth in dividend payout in 2023.
Thus, the critical fact is that the total repatriation of capital and income is estimated to be higher than gross FDI inflows into the country.
Fall in Indian FDIs not isolated
Long-term trends show that net FDI inflows into India as a proportion of GDP have declined from the peak of 3.5% in FY09 to a 20-year low of 0.7% in FY24. But this is not isolated data.
The cumulative rise in protectionism in the post-GFC (2008) era, its intensification since the US-China trade war (2018), and the aftermath of the pandemic have resulted in a shrinkage in global FDI flows.
FDI inflows as a percentage of global GDP have declined to 1.3% in 2023, the lowest since 1996 and the peak of 3.2% in 2007. Hence, India’s FDI/GDP ratio decline has been somewhat larger than global declines.
The trade impulses are set to worsen again after a brief post-pandemic hiatus. The US-China trade conflicts have resurfaced with rising technology fragmentation attempts and the US’s latest actions (under section 301, May 15, 2024) to increase tariffs on Chinese imports worth USD 18bn.
With this, the effective tariff rates on Chinese exports could rise to 23.3% (vs 19.3% current) and impact 71% (vs 58.3% current) of goods.
China’s trade and investments also face protectionism by the European Union through promulgating the latest regulatory actions to safeguard economic security (Jan’24).
India’s outlook sensitive to global protectionism
During the global trade liberalization phase (FY93-FY08), India’s real trade expanded by 14.8% CAGR.
But since then, it has decelerated sharply; 5.7% CAGR in the post-COVID era and 4.3% during FY13-FY24. Thus, rising global trade protectionism has been associated with deceleration in private capex, job creation, household income & consumption, and higher public & household debt.
US restrictions on Chinese imports could intensify dumping in India. Only select sectors can sustain gains from the China+1 theme viz. Electric equipment, general machinery, auto parts, semiconductors, and apparel.
India’s declining FDI and sporadic FPI
Since FY15, the consistency between FPI and FDI inflows has broken. At USD 10.4 bn in FY24, net FDI has dropped to a 13-year low (average USD 29bn) and 59% lower than the FY21 peak of USD 44bn.
FPI flows (USD 35bn in FY24) have been negative or flat in 5 out of the last 8 years. They characterize diminishing longer-term fixed capital commitments by foreign firms in India.
Foreign investments a conduit for repatriation
The contraction in net FDI in India has been largely due to the sustained rise in FDI repatriation and the recent decline in gross FDI inflows.
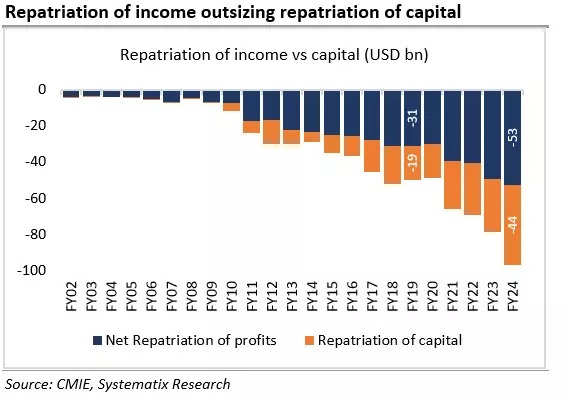
FDI repatriation has risen from USD 9.8bn in FY14 (or 15% of gross FDI) to USD 44bn in FY24 (or 63%). Additionally, the net repatriation of incomes (USD 51bn, profits of MNCs) from India is rising even faster.
Overall, the intent of MNCs in India appears to be dominated by repatriation (USD 95bn, both capital and net income).
Intended gains from Make in India and PLI remain elusive
FDI inflows are increasingly concentrated in fewer sectors, mainly IT, trading, and non-conventional energy where the opportunities are either episodic or long-term transformations.
Since FY17 the concentration of the top 9 sectors in FDI inflows, mainly services, has risen from 49% to 70% in FY24E. Contrastingly, the share of a wide range of 53 sectors, predominantly manufacturing, has declined to 30%.
Sectoral FDI flows outside the IT sector indicate a dominating intent to tap into domestic opportunities rather than create an export base. Of the 14 focus sectors under the PLI scheme, only non-conventional energy has gained prominence in FDI inflows.
Have FTAs benefitted India?
India has aggressively shifted towards free trade agreements (FTAs) and policy incentives in recent years. The objective has been attracting FDIs into manufacturing, creating export hubs, and generating employment. Evidence, however, shows that such gains have been inadequate.
After the initial years, India’s trade deficit with FTA partners increased substantially as the reduction of high import duties by India allowed greater market access to the FTA partner countries.
India’s merchandise trade deficit with FTA partners increased significantly from 2007-09 & 2020-22; 300% with ASEAN countries, 161% with South Korea, and 138% with Japan.
Conversely, India’s exports gained little as FTA partners typically had low import duties. Thus, easing FDI regulations and narrowing relative import duties have not incentivized export-oriented FDIs.
The discernible decline in FDI flows into India blunts the policy actions to invigorate FTA, provide tax incentives, and ease FDI regulations. The relapse of global trade conflicts would still weigh on the outlook of external capital flows.
Select sectors appear to be gaining from the ongoing China+1 theme. Foreign capital flows are increasingly becoming opportunistic. In recent years FDIs and FTAs have catalyzed more outflows through outward repatriation and widening trade deficit.
India needs sharper FTAs, with greater calibration including relative sectoral advantages, a common exclusion list across all FTAs, and real market access.
India needs heavy lifting to revive domestic savings and demand thereby stimulating private capex, employment, export competitiveness, and overall productivity.

(The author is Co Head of Equities & Head of Research – Strategy & Economics at Systematix Group)
(Disclaimer: Recommendations, suggestions, views, and opinions given by experts are their own. These do not represent the views of the Economic Times)


