By RoboForex Analytical Department
AUD/USD rebounded on Thursday after three consecutive days of declines. This was supported by robust employment data from Australia, which bolstered the hawkish outlook on the Reserve Bank of Australia’s (RBA) monetary policy.
Key Employment Data Highlights:
- Job creation: the Australian economy added 64.1k jobs in September, significantly surpassing the expected 25.0k. This marked improvement suggests strong economic momentum
- Unemployment rate: the rate held steady at 4.1%, aligning with expectations and underscoring the labour market’s resilience
- Labour force participation: the participation rate rose to a record 67.2% in September from 67.1% in August, beating the forecast of 67.1%. This increase reflects a growing workforce, which could sustain consumer spending and economic activity
These indicators of labour market strength make it less likely that the RBA will opt for rate cuts in the near term. Additionally, RBA Deputy Governor Sarah Hunter emphasised the central bank’s commitment to controlling inflation, which continues to be a concern amid sustained price increases. Analysts now suggest that the RBA is unlikely to cut rates until at least the first half of the next year, considering the tight labour market conditions.
Technical analysis of AUD/USD
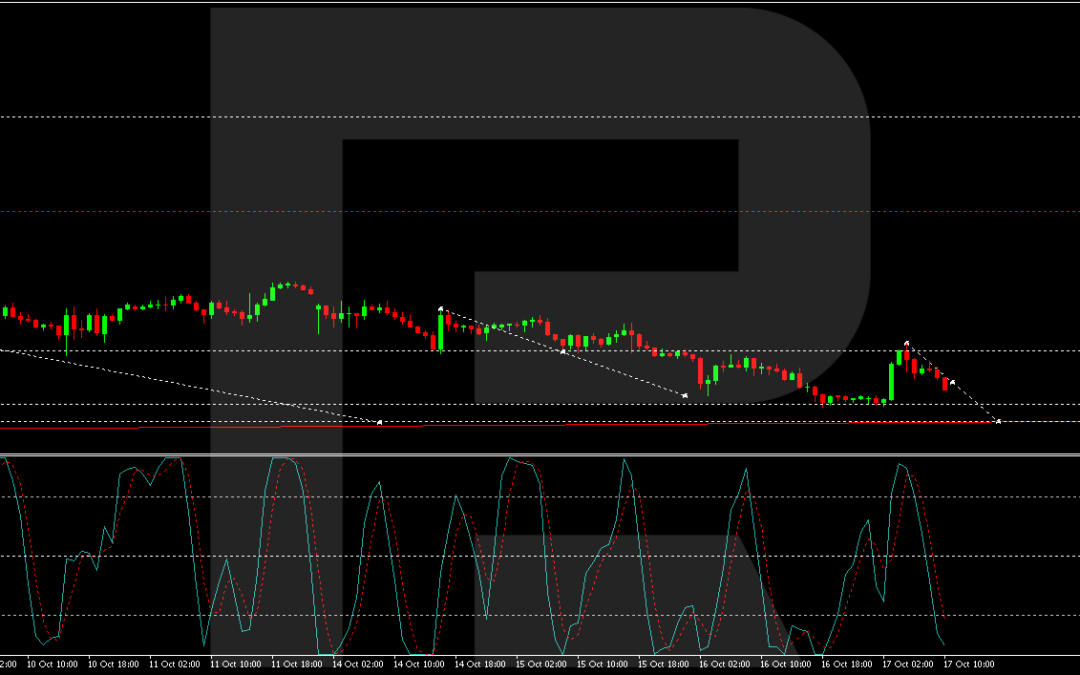
The AUD/USD pair is extending its downward movement towards a target of 0.6645. After testing the resistance at 0.6700 from below, it continues its decline. Once the 0.6645 level is reached, a new consolidation range is expected to form above this level. A breakout above this range could initiate a corrective phase towards 0.6790. This bearish trend is supported by the MACD indicator, which remains below zero and points downwards, indicating sustained downward momentum.

On the hourly chart, AUD/USD has completed a downward wave to 0.6660, followed by a corrective rise to 0.6700. The pair is expected to continue its decline to the 0.6645 level. After this target is met, a potential reversal could push the price towards 0.6710. The Stochastic oscillator supports this outlook, with its signal line below 50 and heading towards 20, suggesting that there may be further downside before any significant recovery.
Disclaimer
Any forecasts contained herein are based on the author’s particular opinion. This analysis may not be treated as trading advice. RoboForex bears no responsibility for trading results based on trading recommendations and reviews contained herein.

- Inflationary pressures continue to ease in the UK and New Zealand Oct 16, 2024
- EUR/USD Continues Downward Amid Economic Uncertainties Oct 16, 2024
- India is experiencing a surge in inflation. US stock indices are once again updating historical highs. Oct 15, 2024
- Brent: Slumps on easing Middle East fears Oct 15, 2024
- USD/JPY Faces Resistance Amid Geopolitical and Economic Uncertainties Oct 15, 2024
- COT Metals Charts: Speculator Bets led by Steel & Palladium Oct 12, 2024
- COT Bonds Charts: Speculator Bets led by 10-Year Bonds & US Treasury Bonds Oct 12, 2024
- COT Soft Commodities Charts: Speculator Bets led higher by Corn & Soybeans Oct 12, 2024
- COT Stock Market Charts: Speculator Bets led by MSCI EAFE-Mini & VIX Oct 12, 2024
- Gold Recovers Amid Mixed US Economic Indicators Oct 11, 2024


