By InvestMacro
The latest update for the weekly Commitment of Traders (COT) report was released by the Commodity Futures Trading Commission (CFTC) on Friday for data ending on June 25th.
This weekly Extreme Positions report highlights the Most Bullish and Most Bearish Positions for the speculator category. Extreme positioning in these markets can foreshadow strong moves in the underlying market.
To signify an extreme position, we use the Strength Index (also known as the COT Index) of each instrument, a common method of measuring COT data. The Strength Index is simply a comparison of current trader positions against the range of positions over the previous 3 years. We use over 80 percent as extremely bullish and under 20 percent as extremely bearish. (Compare Strength Index scores across all markets in the data table or cot leaders table)
Speculators or Non-Commercials Notes:
Speculators, classified as non-commercial traders by the CFTC, are made up of large commodity funds, hedge funds and other significant for-profit participants. The Specs are generally regarded as trend-followers in their behavior towards price action – net speculator bets and prices tend to go in the same directions. These traders often look to buy when prices are rising and sell when prices are falling. To illustrate this point, many times speculator contracts can be found at their most extremes (bullish or bearish) when prices are also close to their highest or lowest levels.
These extreme levels can be dangerous for the large speculators as the trade is most crowded, there is less trading ammunition still sitting on the sidelines to push the trend further and prices have moved a significant distance. When the trend becomes exhausted, some speculators take profits while others look to also exit positions when prices fail to continue in the same direction. This process usually plays out over many months to years and can ultimately create a reverse effect where prices start to fall and speculators start a process of selling when prices are falling.
Here Are This Week’s Most Bullish Speculator Positions:
Australian Dollar

The Australian Dollar speculator position comes in as the most bullish extreme standing this week. The Australian Dollar speculator level is currently at a 100.0 percent score of its 3-year range.
The six-week trend for the percent strength score totaled 63.8 this week. The overall net speculator position was a total of -23,676 net contracts this week with a jump of 17,980 contract in the weekly speculator bets.
New Zealand Dollar

The New Zealand Dollar speculator position comes next in the extreme standings this week. The New Zealand Dollar speculator level is now at a 100.0 percent score of its 3-year range.
The six-week trend for the percent strength score was 79.0 this week. The speculator position registered 26,642 net contracts this week with a weekly boost of 6,313 contracts in speculator bets.
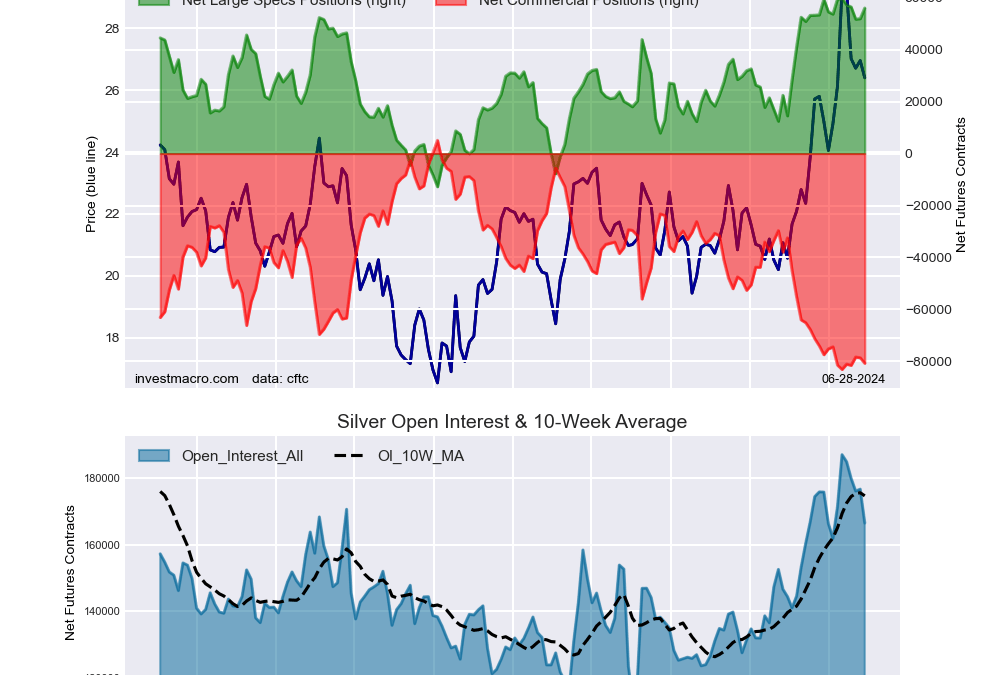
Silver

The Silver speculator position comes in third this week in the extreme standings. The Silver speculator level resides at a 94.9 percent score of its 3-year range.
The six-week trend for the speculator strength score came in at -4.8 this week. The overall speculator position was 55,978 net contracts this week with a gain of 4,077 contracts in the weekly speculator bets.
Coffee

The Coffee speculator position comes up number four in the extreme standings this week. The Coffee speculator level is at a 94.8 percent score of its 3-year range.
The six-week trend for the speculator strength score totaled a change of 13.1 this week. The overall speculator position was 70,712 net contracts this week with a rise of 3,163 contracts in the speculator bets.
Gold

The Gold speculator position rounds out the top five in this week’s bullish extreme standings. The Gold speculator level sits at a 87.3 percent score of its 3-year range. The six-week trend for the speculator strength score was 18.8 this week.
The speculator position was 246,229 net contracts this week with an increase by 3,145 contracts in the weekly speculator bets.

This Week’s Most Bearish Speculator Positions:
Soybean Oil

The Soybean Oil speculator position comes in as the most bearish extreme standing this week. The Soybean Oil speculator level is at a 0.0 percent score of its 3-year range.
The six-week trend for the speculator strength score was -13.8 this week. The overall speculator position was -75,739 net contracts this week with a drop of -28,553 contracts in the speculator bets.
Cotton

The Cotton speculator position comes in next for the most bearish extreme standing on the week. The Cotton speculator level is at a 2.5 percent score of its 3-year range.
The six-week trend for the speculator strength score was -20.4 this week. The speculator position was -23,975 net contracts this week with a rise of 3,789 contracts in the weekly speculator bets.
Japanese Yen

The Japanese Yen speculator position comes in as third most bearish extreme standing of the week. The Japanese Yen speculator level resides at a 3.8 percent score of its 3-year range.
The six-week trend for the speculator strength score was -29.9 this week. The overall speculator position was -173,900 net contracts this week with a large drop by -26,147 contracts in the speculator bets.
5-Year Bond

The 5-Year Bond speculator position comes in as this week’s fourth most bearish extreme standing. The 5-Year Bond speculator level is at a 5.2 percent score of its 3-year range.
The six-week trend for the speculator strength score was -9.6 this week. The speculator position was -1,486,197 net contracts this week with a decline of -32,797 contracts in the weekly speculator bets.
Palladium

Finally, the Palladium speculator position comes in as the fifth most bearish extreme standing for this week. The Palladium speculator level is at a 6.2 percent score of its 3-year range.
The six-week trend for the speculator strength score was -12.3 this week. The speculator position was -12,906 net contracts this week with an edge higher by 650 contracts in the weekly speculator bets.
Article By InvestMacro – Receive our weekly COT Newsletter
*COT Report: The COT data, released weekly to the public each Friday, is updated through the most recent Tuesday (data is 3 days old) and shows a quick view of how large speculators or non-commercials (for-profit traders) were positioned in the futures markets.
The CFTC categorizes trader positions according to commercial hedgers (traders who use futures contracts for hedging as part of the business), non-commercials (large traders who speculate to realize trading profits) and nonreportable traders (usually small traders/speculators) as well as their open interest (contracts open in the market at time of reporting). See CFTC criteria here.

- Is a China-Taiwan Conflict Likely? Watch the Region’s Stock Market Indexes Jun 28, 2024
- Today, the focus of investors’ attention is on the PCE index data Jun 28, 2024
- Week Ahead: FRA40 braced for French elections Jun 28, 2024
- EUR/USD continues to struggle amid US inflation concerns Jun 28, 2024
- Silver prices fell to a 6-week low. Japanese authorities may intervene again to support the yen exchange rate Jun 27, 2024
- Yen under pressure as USD/JPY hits new highs since 1986 Jun 27, 2024
- Bitcoin: Waits on key risk event Jun 26, 2024
- AUD/USD surged, buoyed by RBA confidence and inflation growth Jun 26, 2024
- RBA may raise rates amid price hikes. BoC is likely to postpone rate cuts amid inflationary pressures Jun 26, 2024
- Brent crude oil hits two-month high amid geopolitical tensions Jun 25, 2024


 with Canonical Rollup Integration 15")


