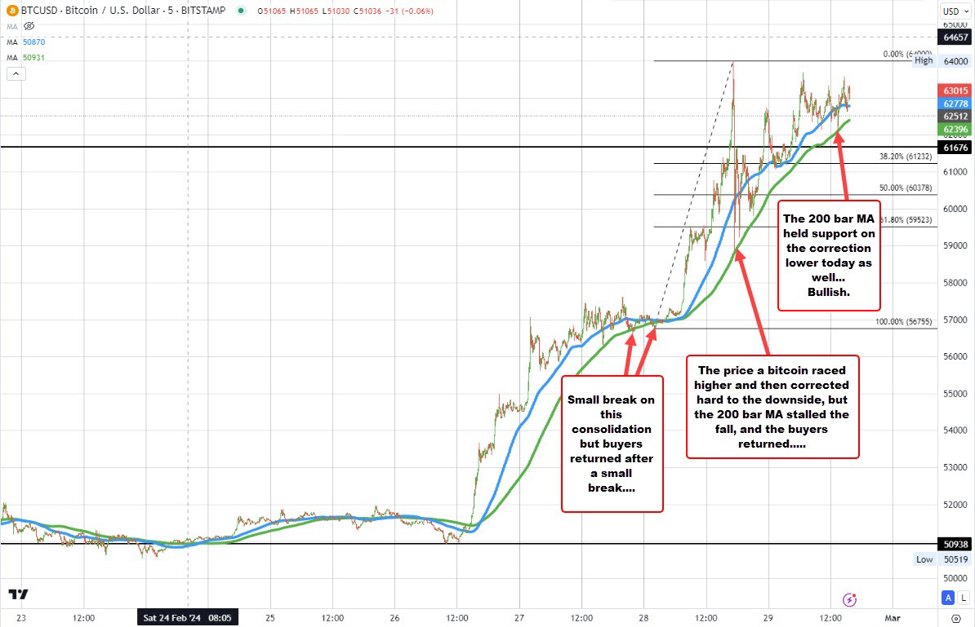
Bitcoin is higher on the day. The closing level yesterday was at $62,512. The current price is at $63,281.
Yesterday saw a huge run up from $56,755-$64,000 at its session high. After that trend move higher, the price tumbled down to a low of $58,835 before bouncing higher again.
The price action has been to the upside but with up-and-down volatility.
In my video a few days ago I spoke to the shorter-term 5minute chart. More specifically I suggested that until the 200-bar moving average on that shorter-term chart is broken with momentum (and stayed broken), the buyers were in firm control.
Bitcoin buyers remain in firm control
Looking at the 5-minute chart above, the sharp fall from the $64,000 level stalled right against its 200-bar moving average (green line in the chart above). In trading today, a corrective low also stalled near the 200-bar moving average and bounced higher.
Since bottoming and starting its run-up on February 26, there have only been a few five-minute bars that have traded below the 200 bar moving average (during a consolidation on Tuesday and Wednesday) but clearly, even on the breaks, the momentum has been modest (sellers did not jump on), and the price quickly reversed back to the upside.
The 200-bar moving average is currently at $62,396. The current price is at $62,973.
Going forward, watch that 200-bar MA moving average level (green line on chart above) for a bias defining level. A move below – and staying below – is needed to give the sellers some hope and more confidence (at least in the short term) that a high is in place (for now). Absent that, and the sellers are not winning. The buyers are in firm control.


