Charts of crude-oil futures have just flashed a bearish signal the likes of which hasn’t been seen since just before the plunge that preceded the demand destruction caused by the COVID-19 pandemic in early 2020.
A bearish “death cross” pattern appeared Tuesday, with the 50-day moving average for crude futures
CL.1,
CL00,
crossing below the 200-DMA.
The 50-DMA is a widely followed short-term trend tracker, while many view the 200-DMA as a dividing line between longer-term uptrends and downtrends. So a death cross is seen by many Wall Street chart watchers as marking the spot that a shorter-term pullback transforms into to a longer-term downtrend.
Read: Dow sees first bearish ‘death cross’ since March 2022. Here is what typically happens next.
The death cross comes as crude futures rose 3.1% on Tuesday but have tumbled 16.1% over the past three months.
The last time crude futures’ 50-DMA fell below the 200-DMA was Sept. 7, 2022, when continuous crude futures closed at $81.94. While prices eventually fell, they actually rallied over the next couple of months, to close 12% higher at $91.79 on Nov. 7, 2022.
But there are some chart watchers, such as Fairlead Strategies LLC technical analyst Katie Stockton, who wouldn’t consider that crossover a real death cross, since the 200-DMA was rising when it appeared.
In September 2022, a crude-oil death cross appeared with 200-DMA rising, and prices rallied for the next two months before turning lower.
FactSet, MarketWatch
The 50-DMA had dropped to $95.107 on Sept. 7 from $95.659 on Sept. 6, according to FactSet data, while the 200-DMA rose to $95.60 from $95.58.
The death cross that appeared Tuesday, however, comes with the 50-DMA falling to $77.456 from $77.739 and the 200-DMA slipping to $77.647 from $77.663.
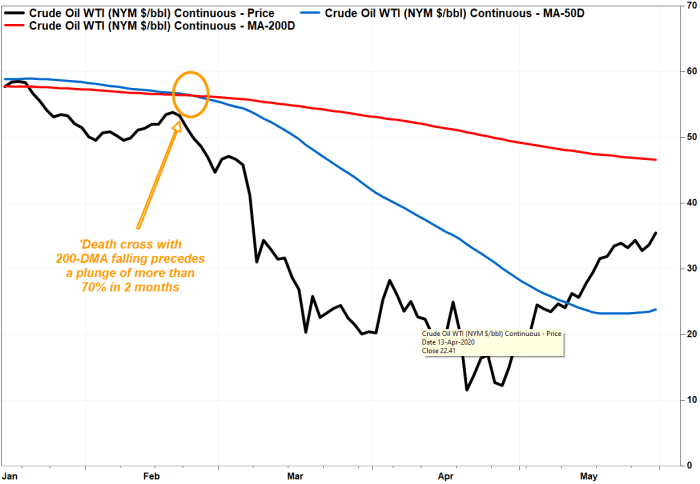
The last time a real death cross appeared was Feb. 25, 2020, when the 50-DMA declined to $56.377 from $56.554 the day before, and the 200-DMA edged down to $56.396 from $56.455. Crude futures closed that day at $49.90.
About three weeks later, when the World Health Organization declared COVID-19 a pandemic, crude was 34% lower at $32.98. And two months after the death cross, crude closed 74% lower at $12.78, as the pandemic led to concerns over an overflow of supply coupled with a plunge in demand.

In 2020, a death cross preceded a big plunge as the COVID-19 pandemic fueled demand-destruction fears.
FactSet, MarketWatch
Moving-average crossovers aren’t meant to be good market-timing signals, given that they are well telegraphed. They can, however, provide some historical perspective on how long and how far a current trend has traveled.
For example, Tuesday’s crossover comes at a time when fundamentals may appear rather bullish. As Ipek Ozkardeskaya, senior analyst at Swissquote Bank, said in a note to clients Tuesday, “bulls have all the reasons on earth” to push crude prices higher, including an intensifying and apparent expansion of violence in the Middle East, production restrictions and expectations that central banks may soon start trying to boost economic growth by lowering interest rates.
“But interestingly, none has been enough to strengthen the back of the bulls,” Ozkardeskaya wrote.
In November, after prices fell below the 200-DMA, bulls tried a number of times to reclaim control by getting back above that line but failed to do so. That suggested bears already had the technical momentum on their side.
When prices and widely followed fundamentals have apparently contradicted each other in the past, it tends to be prices that prove prescient. In the case of crude, while many may be focusing on potential supply disruptions to be bullish, the real underlying issue driving prices may be concerns over future demand amid slowing economic growth, as the 2020 death cross predicted.
If crude prices don’t start making some technical progress soon, Ozkardeskaya believes a drop below the $70-per-barrel mark could be on the horizon.
“If that’s the case, there will be even more reason to be confident about a series of [Federal Reserve] rate cuts next year,” Ozkardeskaya wrote.


