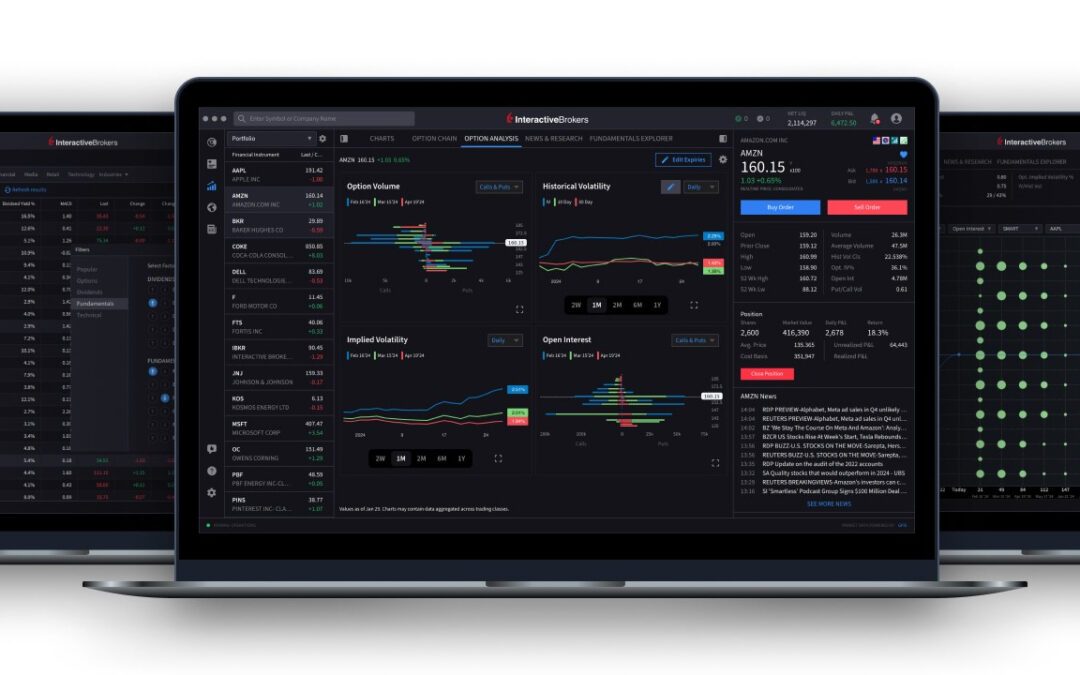
Electronic trading major Interactive Brokers has launched Version 0.11 (Beta release) of the IBKR Desktop platform, adding a slew of new indicators.
The list of new indicators includes:
This classic technical indicator identifies potential support and resistance levels based on historical price data. It calculates key pivot levels for the day, allowing traders to anticipate market movements and make more informed decisions on entries and exits.
- Volume Profile Fixed Range
This indicator offers a detailed view of trading activity across a specific time period. By plotting volume at each price level within a fixed range, it helps traders understand where the most significant trading activity occurs, which can highlight key support and resistance levels.
- Volume Profile Visible Range
Similar to the Fixed Range Volume Profile, this indicator dynamically adjusts to the visible portion of the chart. It displays the volume traded at each price level within the current chart view, making it easier to identify price levels with the highest volume and understand the most recent market trends.
This indicator tracks the highest and lowest price levels over the last 52 weeks. It’s a valuable tool for identifying long-term support and resistance levels, giving you insight into significant market turning points and overall market sentiment.
Designed to measure market momentum, the Accelerator Oscillator helps traders identify shifts in the speed of price movement. Positive values suggest upward acceleration, while negative values indicate downward momentum. It can be used alongside other momentum indicators to confirm or anticipate market trends.
This indicator measures the strength of the relationship between two assets. The correlation coefficient ranges from -1 to 1, where 1 indicates a perfect positive correlation, -1 signals a perfect negative correlation, and 0 implies no correlation. It’s an essential tool for portfolio diversification and risk management.
- Guppy Multiple Moving Average
The Guppy Multiple Moving Average applies a series of short-term and long-term moving averages to track the relationship between traders and long-term investors. It is widely used to identify breakouts, trends, and potential reversals, offering a comprehensive view of market conditions.
The Ratio indicator compares two securities, dividing the price of one by another. This is useful for relative strength analysis, providing insight into which asset is outperforming the other over a given time period.
The Spread indicator helps track the price difference between two securities. Commonly used in pair trading, it allows you to assess divergence or convergence in price behavior, aiding in strategies that rely on arbitrage or correlation.
The True Strength Index is a momentum-based indicator that smooths price data over multiple periods to help traders identify trends and reversals. It is particularly effective in identifying overbought or oversold conditions, providing signals for potential trade entry and exit points.
IBKR Desktop is built from the ground up using a more modern UI framework with simplified navigation. The perfect alternative for active clients who prefer a more lightweight platform, IBKR Desktop includes the most popular tools from Interactive Brokers’ flagship TWS platform with the same great order execution.


