By InvestMacro
The latest update for the weekly Commitment of Traders (COT) report was released by the Commodity Futures Trading Commission (CFTC) on Friday for data ending on September 16th.
This weekly Extreme Positions report highlights the Most Bullish and Most Bearish Positions for the speculator category. Extreme positioning in these markets can foreshadow strong moves in the underlying market.
To signify an extreme position, we use the Strength Index (also known as the COT Index) of each instrument, a common method of measuring COT data. The Strength Index is simply a comparison of current trader positions against the range of positions over the previous 3 years. We use over 80 percent as extremely bullish and under 20 percent as extremely bearish. (Compare Strength Index scores across all markets in the data table or cot leaders table)
Here Are This Week’s Most Bullish Speculator Positions:
Lean Hogs

The Lean Hogs speculator position comes in as the most bullish extreme standing this week as the Lean Hogs speculator level sits currently at a 99 percent score of its 3-year range.
The six-week trend for the percent strength score totaled a rise by 17 percentage points this week. The overall net speculator position was a total of 95,098 net contracts this week with an increase by 3,514 contract in the weekly speculator bets.
Speculators or Non-Commercials Notes:
Speculators, classified as non-commercial traders by the CFTC, are made up of large commodity funds, hedge funds and other significant for-profit participants. The Specs are generally regarded as trend-followers in their behavior towards price action – net speculator bets and prices tend to go in the same directions. These traders often look to buy when prices are rising and sell when prices are falling. To illustrate this point, many times speculator contracts can be found at their most extremes (bullish or bearish) when prices are also close to their highest or lowest levels.
These extreme levels can be dangerous for the large speculators as the trade is most crowded, there is less trading ammunition still sitting on the sidelines to push the trend further and prices have moved a significant distance. When the trend becomes exhausted, some speculators take profits while others look to also exit positions when prices fail to continue in the same direction. This process usually plays out over many months to years and can ultimately create a reverse effect where prices start to fall and speculators start a process of selling when prices are falling.
Brazil Real

The Brazil Real speculator position comes next in the extreme standings this week. The BRL speculator level is now at a 95 percent score of its 3-year range.
The six-week trend for the percent strength score was a gain of 31 percentage points this week. The speculator position registered 62,222 net contracts this week with a weekly boost by 6,135 contracts in speculator bets.
MSCI EAFE MINI

The MSCI EAFE MINI speculator position comes in third this week in the extreme standings with the MSCI EAFE-Mini speculator level residing at a 93 percent score of its 3-year range.
The six-week trend for the speculator strength score came in at an increase by 5 percentage points this week. The overall speculator position was 9,549 net contracts this week with a decline of -4,034 contracts in the weekly speculator bets.
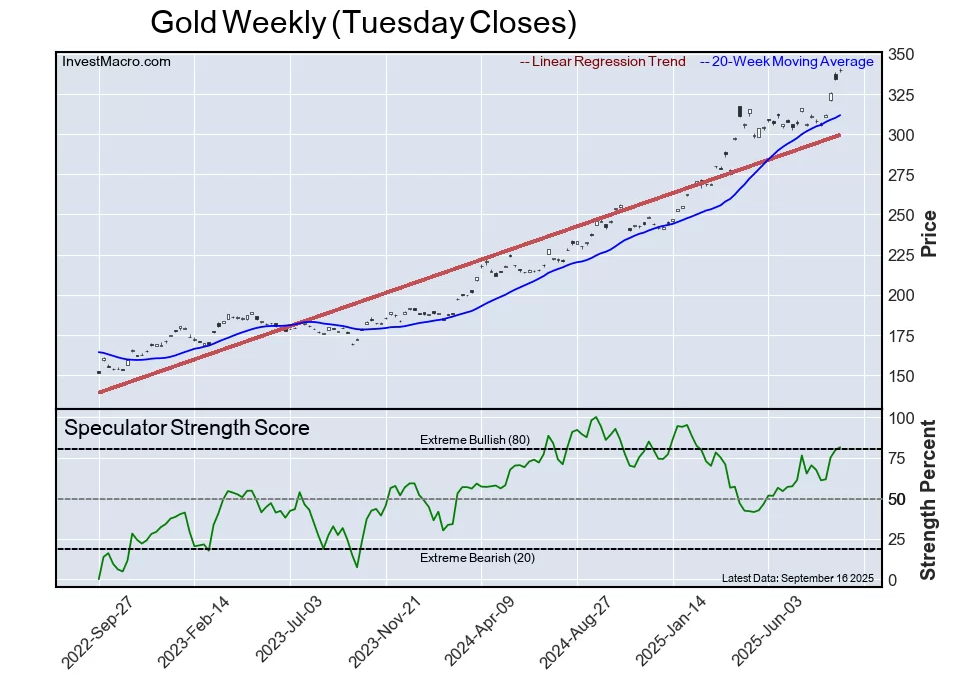
Gold

The Gold speculator position comes up number four in the extreme standings this week. The Gold speculator level is at a 81 percent score of its 3-year range.
The six-week trend for the speculator strength score totaled an advance by 11 percentage points this week. The overall speculator position was 266,410 net contracts this week with a rise of 4,670 contracts in the speculator bets.
Silver

The Silver speculator position rounds out the top five in this week’s bullish extreme standings. The Silver speculator level sits at a 79 percent score of its 3-year range. The six-week trend for the speculator strength score was an edge higher by 1 percentage point this week.
The speculator position was 51,538 net contracts this week with a dip by -2,399 contracts in the weekly speculator bets.
The Most Bearish Speculator Positions of the Week:

1-Month Secured Overnight Financing Rate

The 1-Month Secured Overnight Financing Rate speculator position comes in tied as the most bearish extreme standing this week with the SOFR 1-Month speculator level at a 0 percent score of its 3-year range.
The six-week trend for the speculator strength score was a large drop by -64 percentage points this week. The overall speculator position was -297,794 net contracts this week with a decline of -88,017 contracts in the speculator bets.
US Dollar Index

The US Dollar Index speculator position also comes in tied as the most bearish extreme standing this week. The USD Index speculator level is at a 0 percent score of its 3-year range.
The six-week trend for the speculator strength score was a decline by -13 percentage points this week. The speculator position was -12,894 net contracts this week with a decrease of -7,336 contracts in the weekly speculator bets.
VIX

The VIX speculator position comes in as third most bearish extreme standing of the week. The VIX speculator level resides at just a 5 percent score of its 3-year range.
The six-week trend for the speculator strength score was -13 percentage points this week. The overall speculator position was -101,689 net contracts this week with a change of 6,121 contracts in the speculator bets.
WTI Crude Oil

The WTI Crude Oil speculator position comes in as this week’s fourth most bearish extreme standing. The WTI Crude speculator level is at a 6 percent score of its 3-year range.
The six-week trend for the speculator strength score was a decrease by -16 percentage points this week. The speculator position was 98,709 net contracts this week with a boost by 16,865 contracts in the weekly speculator bets.
2-Year Bond

Next, the 2-Year Bond speculator position comes in as the fifth most bearish extreme standing for this week. The 2-Year speculator level is at a 7 percent score of its 3-year range.
The six-week trend for the speculator strength score was a drop by -7 percentage points this week. The speculator position was -1,403,470 net contracts this week with a decline of -28,509 contracts in the weekly speculator bets.
Article By InvestMacro – Receive our weekly COT Newsletter
*COT Report: The COT data, released weekly to the public each Friday, is updated through the most recent Tuesday (data is 3 days old) and shows a quick view of how large speculators or non-commercials (for-profit traders) were positioned in the futures markets.
The CFTC categorizes trader positions according to commercial hedgers (traders who use futures contracts for hedging as part of the business), non-commercials (large traders who speculate to realize trading profits) and nonreportable traders (usually small traders/speculators) as well as their open interest (contracts open in the market at time of reporting). See CFTC criteria here.

- COT Metals Charts: Weekly Speculator Changes led by Gold & Copper Sep 21, 2025
- COT Bonds Charts: Weekly Speculator Bets led higher by SOFR 3-Months & 5-Year Bonds Sep 21, 2025
- COT Energy Charts: Speculator Bets led higher by WTI Crude Oil Sep 21, 2025
- COT Soft Commodities Charts: Weekly Speculator Bets led higher by Sugar & Corn Sep 21, 2025
- Wall Street indices close at record highs. Norges Bank cuts key rate Sep 19, 2025
- EUR/USD Corrects Lower in Post-Fed Pause Sep 19, 2025
- The US Fed and the Bank of Canada have cut interest rates as expected Sep 18, 2025
- GBP Holds Near Highs as Market Awaits BoE Decision Sep 18, 2025
- Canadian dollar declines after inflation data. Investors take profits ahead of the Fed meeting Sep 17, 2025
- EUR/USD Hits Four-Year High: All Eyes on the Fed Sep 17, 2025


 Development Foundation Joins New Blockchain Payments Consortium 18")
