By InvestMacro
Here are the latest charts and statistics for the Commitment of Traders (COT) data published by the Commodities Futures Trading Commission (CFTC).
The latest COT data is updated through Tuesday April 1st and shows a quick view of how large traders (for-profit speculators and commercial entities) were positioned in the futures markets.
Weekly Speculator Changes led by S&P500 & Nasdaq
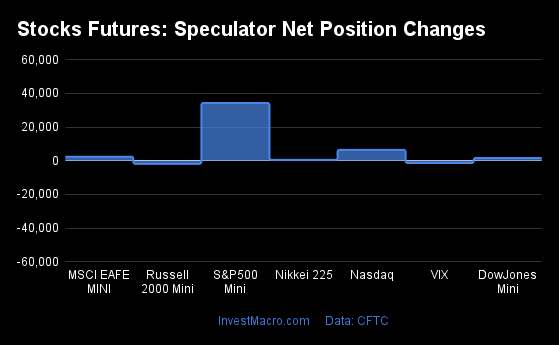
The COT stock markets speculator bets were higher this week (through Tuesday) as five out of the seven stock markets we cover had higher positioning while the other three markets had lower speculator contracts.
Leading the gains for the stock markets was the S&P500-Mini (34,340 contracts) with the Nasdaq-Mini (6,489 contracts), the MSCI EAFE-Mini (2,410 contracts), the DowJones-Mini (1,602 contracts) and the Nikkei 225 (540 contracts) also having positive weeks.
The markets with the declines in speculator bets this week were the Russell-Mini (-1,826 contracts) with the VIX (-1,367 contracts) also seeing lower bets on the week.
Stock Market Net Speculators Leaderboard
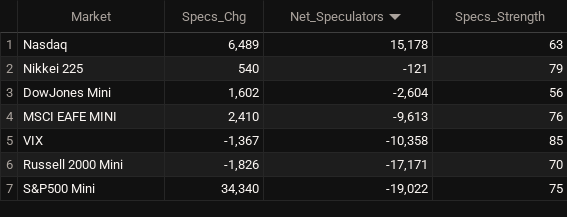
Legend: Weekly Speculators Change | Speculators Current Net Position | Speculators Strength Score compared to last 3-Years (0-100 range)
Strength Scores led by VIX & Nikkei 225
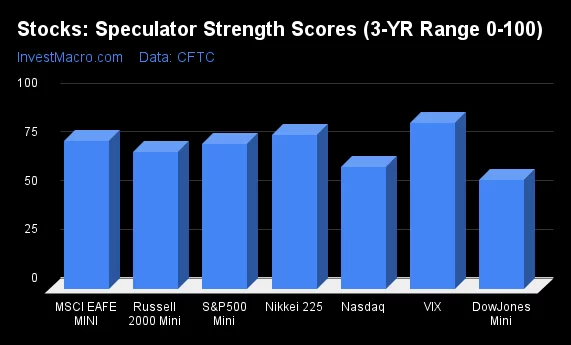
COT Strength Scores (a normalized measure of Speculator positions over a 3-Year range, from 0 to 100 where above 80 is Extreme-Bullish and below 20 is Extreme-Bearish) showed that the VIX (85 percent) and the Nikkei 225 (79 percent) lead the stock markets this week. The MSCI EAFE-Mini (76 percent) and S&P500-Mini (75 percent) come in as the next highest in the weekly strength scores.
On the downside, the DowJones-Mini (56 percent) comes in at the lowest strength level currently.
Strength Statistics:
VIX (85.3 percent) vs VIX previous week (86.5 percent)
S&P500-Mini (74.5 percent) vs S&P500-Mini previous week (68.4 percent)
DowJones-Mini (56.1 percent) vs DowJones-Mini previous week (53.5 percent)
Nasdaq-Mini (62.7 percent) vs Nasdaq-Mini previous week (52.6 percent)
Russell2000-Mini (70.3 percent) vs Russell2000-Mini previous week (71.5 percent)
Nikkei USD (79.1 percent) vs Nikkei USD previous week (74.5 percent)
EAFE-Mini (76.0 percent) vs EAFE-Mini previous week (72.6 percent)
VIX & Nikkei 225 top the 6-Week Strength Trends
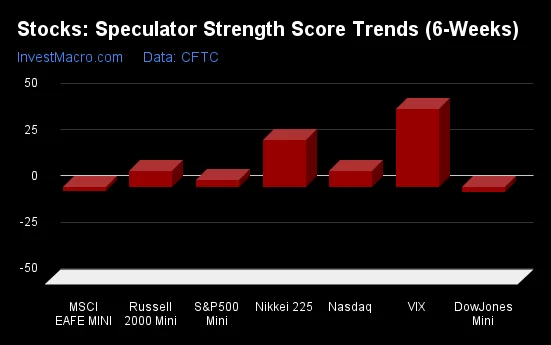
COT Strength Score Trends (or move index, calculates the 6-week changes in strength scores) showed that the VIX (42 percent) leads the past six weeks trends for the stock markets. The Nikkei 225 (25 percent), the Russell-Mini (9 percent) and the Nasdaq-Mini (8 percent) are the next highest positive movers in the latest trends data.
The DowJones-Mini (-3 percent) leads the downside trend scores currently with the EAFE-Mini (-2 percent) coming in as the next market with lower trend scores.
Strength Trend Statistics:
VIX (42.0 percent) vs VIX previous week (44.4 percent)
S&P500-Mini (3.8 percent) vs S&P500-Mini previous week (-6.5 percent)
DowJones-Mini (-2.5 percent) vs DowJones-Mini previous week (-11.5 percent)
Nasdaq-Mini (8.3 percent) vs Nasdaq-Mini previous week (-7.4 percent)
Russell2000-Mini (8.6 percent) vs Russell2000-Mini previous week (11.7 percent)
Nikkei USD (25.1 percent) vs Nikkei USD previous week (17.9 percent)
EAFE-Mini (-2.4 percent) vs EAFE-Mini previous week (-14.2 percent)
Individual Stock Market Charts:
VIX Volatility Futures:
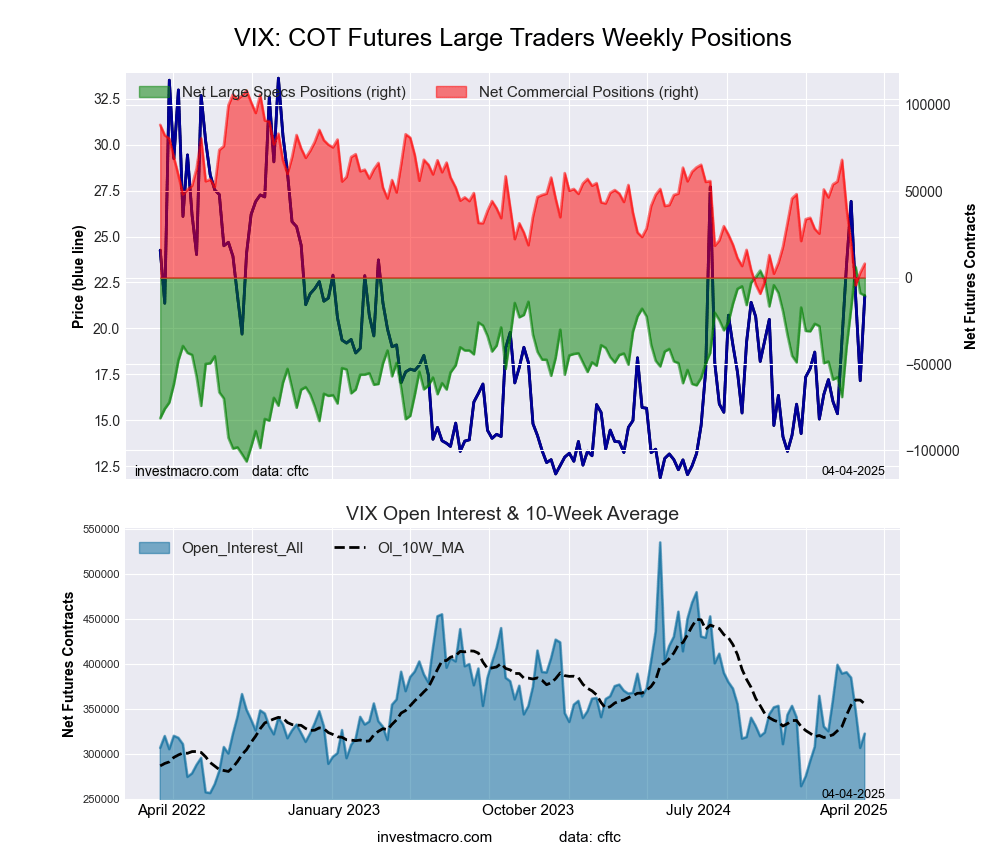 The VIX Volatility large speculator standing this week equaled a net position of -10,358 contracts in the data reported through Tuesday. This was a weekly reduction of -1,367 contracts from the previous week which had a total of -8,991 net contracts.
This week’s current strength score (the trader positioning range over the past three years, measured from 0 to 100) shows the speculators are currently Bullish-Extreme with a score of 85.3 percent. The commercials are Bearish-Extreme with a score of 14.8 percent and the small traders (not shown in chart) are Bullish with a score of 79.2 percent.
Price Trend-Following Model: Strong Uptrend
Our weekly trend-following model classifies the current market price position as: Strong Uptrend.
| VIX Volatility Futures Statistics | SPECULATORS | COMMERCIALS | SMALL TRADERS |
| – Percent of Open Interest Longs: | 29.4 | 42.8 | 9.0 |
| – Percent of Open Interest Shorts: | 32.6 | 40.3 | 8.3 |
| – Net Position: | -10,358 | 8,055 | 2,303 |
| – Gross Longs: | 94,853 | 138,093 | 29,211 |
| – Gross Shorts: | 105,211 | 130,038 | 26,908 |
| – Long to Short Ratio: | 0.9 to 1 | 1.1 to 1 | 1.1 to 1 |
| NET POSITION TREND: | |||
| – Strength Index Score (3 Year Range Pct): | 85.3 | 14.8 | 79.2 |
| – Strength Index Reading (3 Year Range): | Bullish-Extreme | Bearish-Extreme | Bullish |
| NET POSITION MOVEMENT INDEX: | |||
| – 6-Week Change in Strength Index: | 42.0 | -40.5 | 1.4 |
S&P500 Mini Futures:
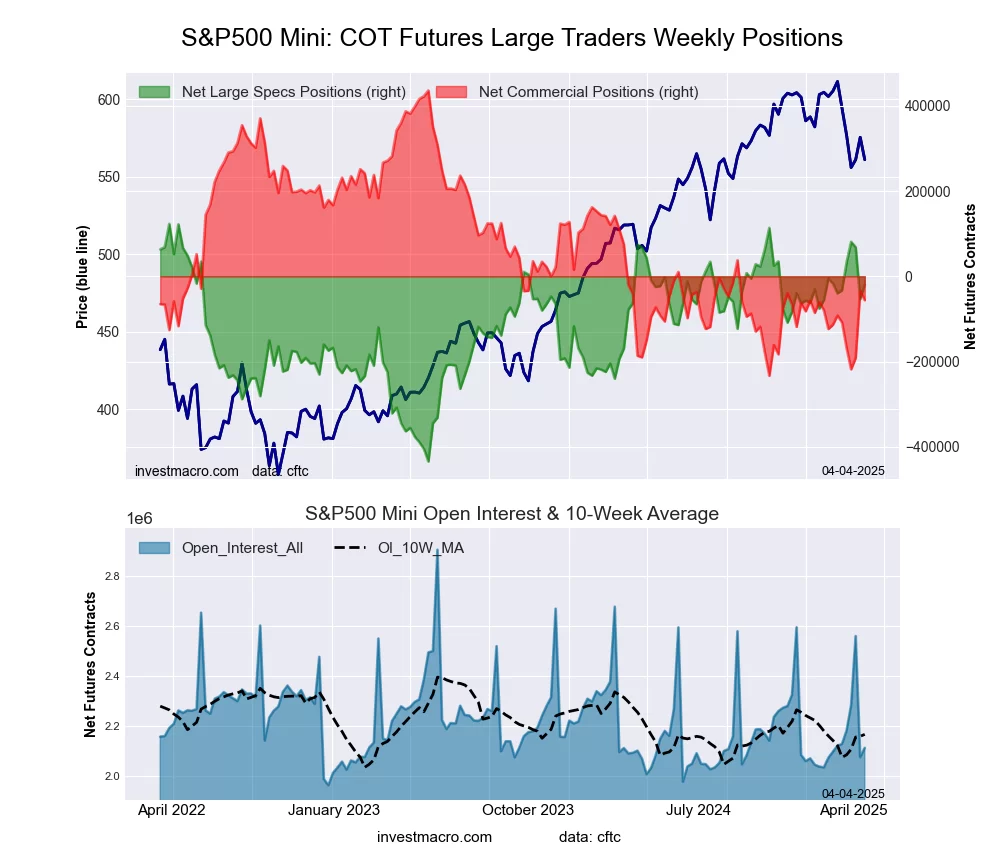 The S&P500 Mini large speculator standing this week equaled a net position of -19,022 contracts in the data reported through Tuesday. This was a weekly advance of 34,340 contracts from the previous week which had a total of -53,362 net contracts.
This week’s current strength score (the trader positioning range over the past three years, measured from 0 to 100) shows the speculators are currently Bullish with a score of 74.5 percent. The commercials are Bearish with a score of 26.5 percent and the small traders (not shown in chart) are Bullish with a score of 67.1 percent.
Price Trend-Following Model: Strong Downtrend
Our weekly trend-following model classifies the current market price position as: Strong Downtrend.
| S&P500 Mini Futures Statistics | SPECULATORS | COMMERCIALS | SMALL TRADERS |
| – Percent of Open Interest Longs: | 14.2 | 71.3 | 11.8 |
| – Percent of Open Interest Shorts: | 15.1 | 73.9 | 8.2 |
| – Net Position: | -19,022 | -56,199 | 75,221 |
| – Gross Longs: | 300,366 | 1,504,785 | 249,432 |
| – Gross Shorts: | 319,388 | 1,560,984 | 174,211 |
| – Long to Short Ratio: | 0.9 to 1 | 1.0 to 1 | 1.4 to 1 |
| NET POSITION TREND: | |||
| – Strength Index Score (3 Year Range Pct): | 74.5 | 26.5 | 67.1 |
| – Strength Index Reading (3 Year Range): | Bullish | Bearish | Bullish |
| NET POSITION MOVEMENT INDEX: | |||
| – 6-Week Change in Strength Index: | 3.8 | 5.4 | -22.5 |
Dow Jones Mini Futures:
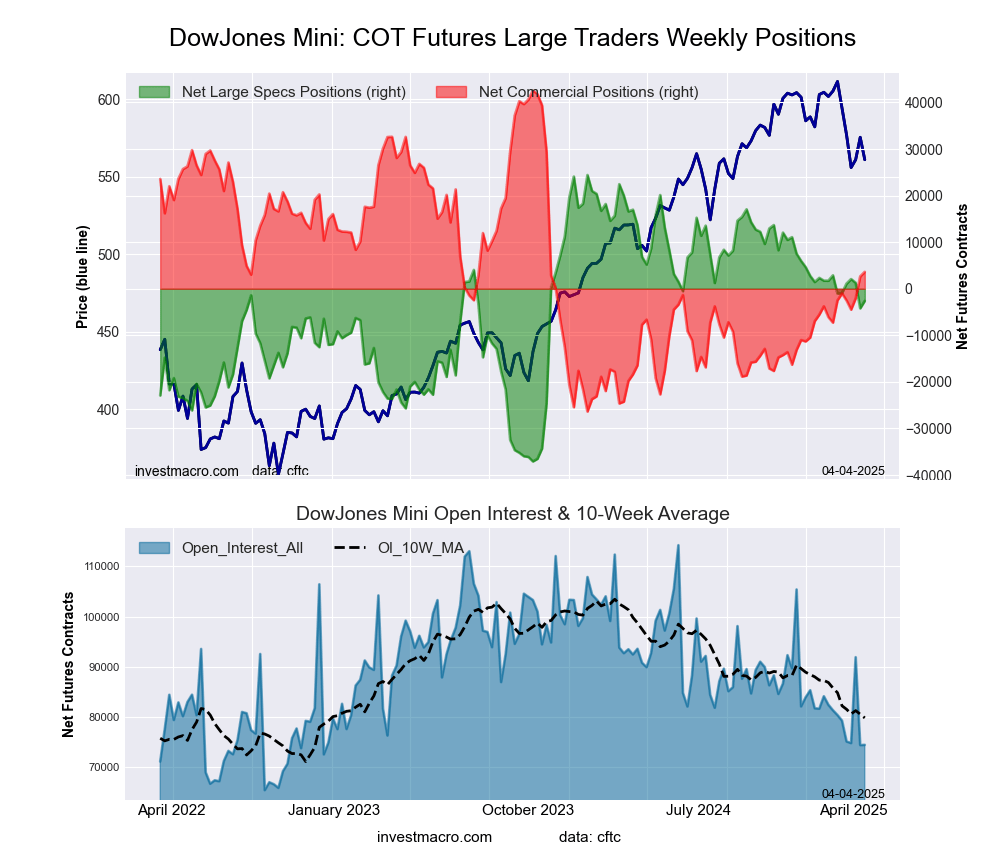 The Dow Jones Mini large speculator standing this week equaled a net position of -2,604 contracts in the data reported through Tuesday. This was a weekly boost of 1,602 contracts from the previous week which had a total of -4,206 net contracts.
This week’s current strength score (the trader positioning range over the past three years, measured from 0 to 100) shows the speculators are currently Bullish with a score of 56.1 percent. The commercials are Bearish with a score of 43.5 percent and the small traders (not shown in chart) are Bearish with a score of 47.7 percent.
Price Trend-Following Model: Strong Downtrend
Our weekly trend-following model classifies the current market price position as: Strong Downtrend.
| Dow Jones Mini Futures Statistics | SPECULATORS | COMMERCIALS | SMALL TRADERS |
| – Percent of Open Interest Longs: | 13.2 | 63.2 | 14.3 |
| – Percent of Open Interest Shorts: | 16.7 | 58.3 | 15.7 |
| – Net Position: | -2,604 | 3,625 | -1,021 |
| – Gross Longs: | 9,846 | 47,045 | 10,660 |
| – Gross Shorts: | 12,450 | 43,420 | 11,681 |
| – Long to Short Ratio: | 0.8 to 1 | 1.1 to 1 | 0.9 to 1 |
| NET POSITION TREND: | |||
| – Strength Index Score (3 Year Range Pct): | 56.1 | 43.5 | 47.7 |
| – Strength Index Reading (3 Year Range): | Bullish | Bearish | Bearish |
| NET POSITION MOVEMENT INDEX: | |||
| – 6-Week Change in Strength Index: | -2.5 | 8.9 | -27.4 |
Nasdaq Mini Futures:
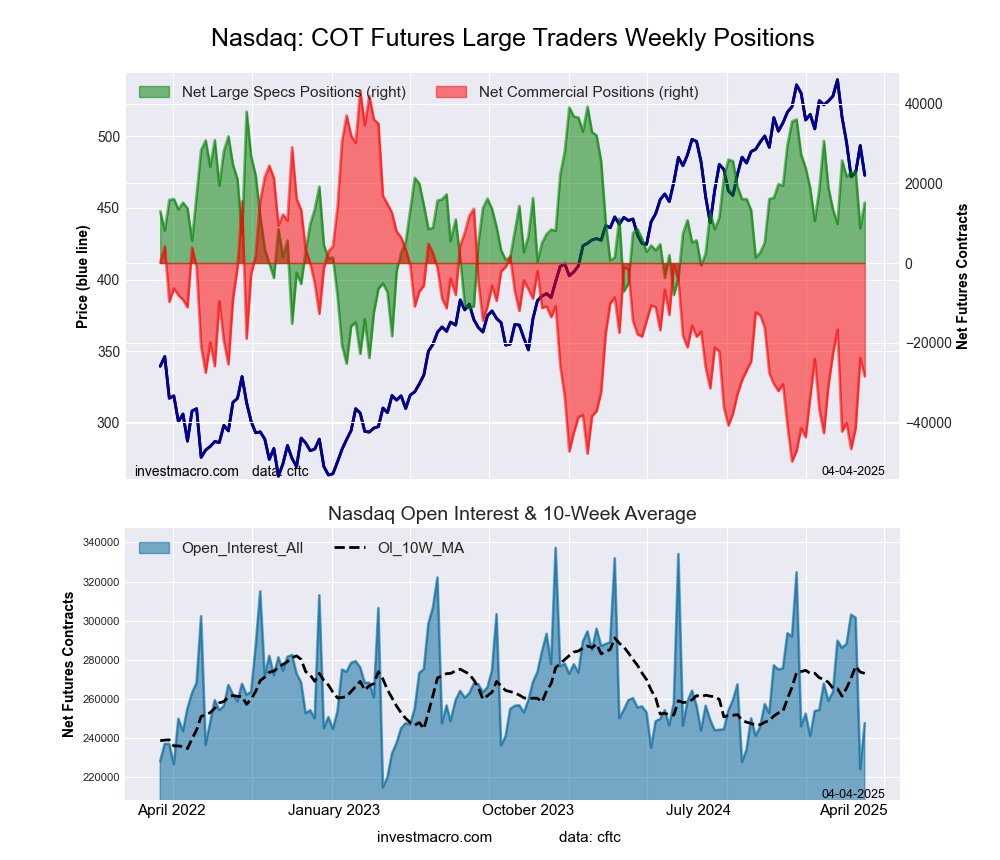 The Nasdaq Mini large speculator standing this week equaled a net position of 15,178 contracts in the data reported through Tuesday. This was a weekly lift of 6,489 contracts from the previous week which had a total of 8,689 net contracts.
This week’s current strength score (the trader positioning range over the past three years, measured from 0 to 100) shows the speculators are currently Bullish with a score of 62.7 percent. The commercials are Bearish with a score of 22.9 percent and the small traders (not shown in chart) are Bullish with a score of 79.7 percent.
Price Trend-Following Model: Strong Downtrend
Our weekly trend-following model classifies the current market price position as: Strong Downtrend.
| Nasdaq Mini Futures Statistics | SPECULATORS | COMMERCIALS | SMALL TRADERS |
| – Percent of Open Interest Longs: | 28.4 | 54.2 | 16.6 |
| – Percent of Open Interest Shorts: | 22.3 | 65.7 | 11.3 |
| – Net Position: | 15,178 | -28,512 | 13,334 |
| – Gross Longs: | 70,420 | 134,323 | 41,232 |
| – Gross Shorts: | 55,242 | 162,835 | 27,898 |
| – Long to Short Ratio: | 1.3 to 1 | 0.8 to 1 | 1.5 to 1 |
| NET POSITION TREND: | |||
| – Strength Index Score (3 Year Range Pct): | 62.7 | 22.9 | 79.7 |
| – Strength Index Reading (3 Year Range): | Bullish | Bearish | Bullish |
| NET POSITION MOVEMENT INDEX: | |||
| – 6-Week Change in Strength Index: | 8.3 | -12.6 | 12.2 |
Russell 2000 Mini Futures:
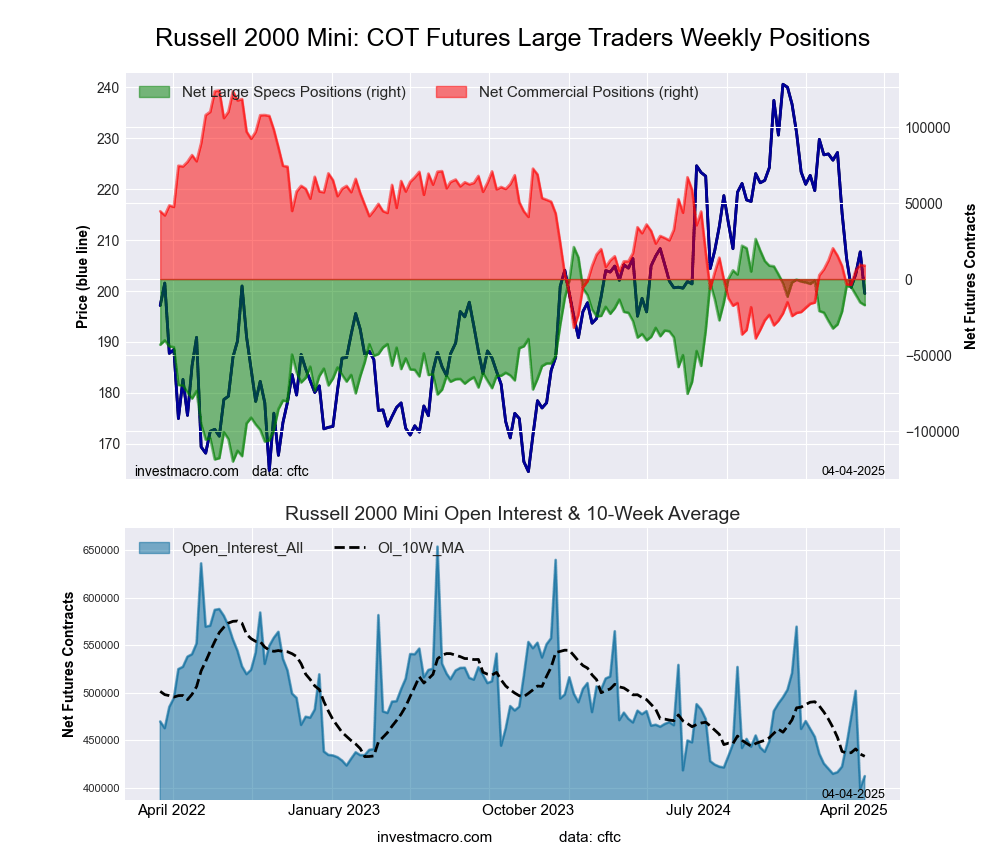 The Russell 2000 Mini large speculator standing this week equaled a net position of -17,171 contracts in the data reported through Tuesday. This was a weekly decline of -1,826 contracts from the previous week which had a total of -15,345 net contracts.
This week’s current strength score (the trader positioning range over the past three years, measured from 0 to 100) shows the speculators are currently Bullish with a score of 70.3 percent. The commercials are Bearish with a score of 29.4 percent and the small traders (not shown in chart) are Bearish with a score of 47.8 percent.
Price Trend-Following Model: Strong Downtrend
Our weekly trend-following model classifies the current market price position as: Strong Downtrend.
| Russell 2000 Mini Futures Statistics | SPECULATORS | COMMERCIALS | SMALL TRADERS |
| – Percent of Open Interest Longs: | 17.0 | 69.9 | 8.7 |
| – Percent of Open Interest Shorts: | 21.1 | 67.8 | 6.7 |
| – Net Position: | -17,171 | 8,856 | 8,315 |
| – Gross Longs: | 70,029 | 288,403 | 35,994 |
| – Gross Shorts: | 87,200 | 279,547 | 27,679 |
| – Long to Short Ratio: | 0.8 to 1 | 1.0 to 1 | 1.3 to 1 |
| NET POSITION TREND: | |||
| – Strength Index Score (3 Year Range Pct): | 70.3 | 29.4 | 47.8 |
| – Strength Index Reading (3 Year Range): | Bullish | Bearish | Bearish |
| NET POSITION MOVEMENT INDEX: | |||
| – 6-Week Change in Strength Index: | 8.6 | -4.0 | -17.2 |
Nikkei Stock Average (USD) Futures:
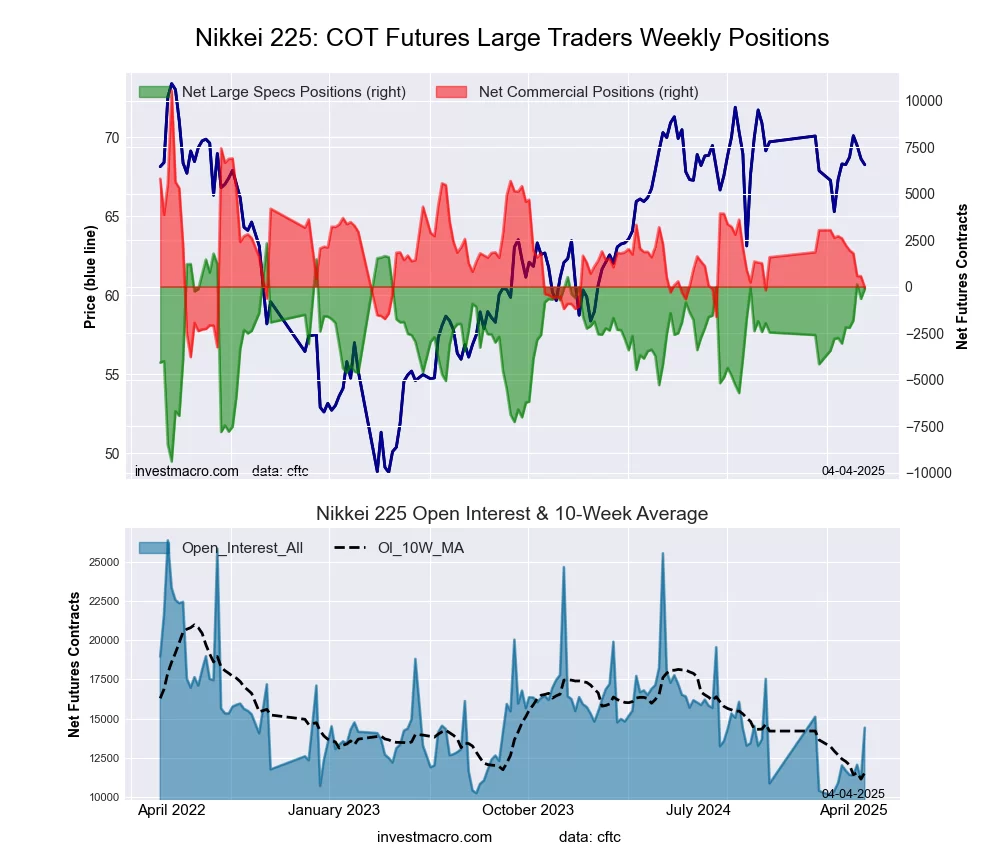 The Nikkei Stock Average (USD) large speculator standing this week equaled a net position of -121 contracts in the data reported through Tuesday. This was a weekly boost of 540 contracts from the previous week which had a total of -661 net contracts.
This week’s current strength score (the trader positioning range over the past three years, measured from 0 to 100) shows the speculators are currently Bullish with a score of 79.1 percent. The commercials are Bearish with a score of 26.1 percent and the small traders (not shown in chart) are Bearish with a score of 46.3 percent.
Price Trend-Following Model: Strong Downtrend
Our weekly trend-following model classifies the current market price position as: Strong Downtrend.
| Nikkei Stock Average Futures Statistics | SPECULATORS | COMMERCIALS | SMALL TRADERS |
| – Percent of Open Interest Longs: | 7.4 | 69.0 | 19.5 |
| – Percent of Open Interest Shorts: | 8.2 | 69.3 | 18.4 |
| – Net Position: | -121 | -46 | 167 |
| – Gross Longs: | 1,068 | 9,952 | 2,817 |
| – Gross Shorts: | 1,189 | 9,998 | 2,650 |
| – Long to Short Ratio: | 0.9 to 1 | 1.0 to 1 | 1.1 to 1 |
| NET POSITION TREND: | |||
| – Strength Index Score (3 Year Range Pct): | 79.1 | 26.1 | 46.3 |
| – Strength Index Reading (3 Year Range): | Bullish | Bearish | Bearish |
| NET POSITION MOVEMENT INDEX: | |||
| – 6-Week Change in Strength Index: | 25.1 | -18.4 | -5.9 |
MSCI EAFE Mini Futures:
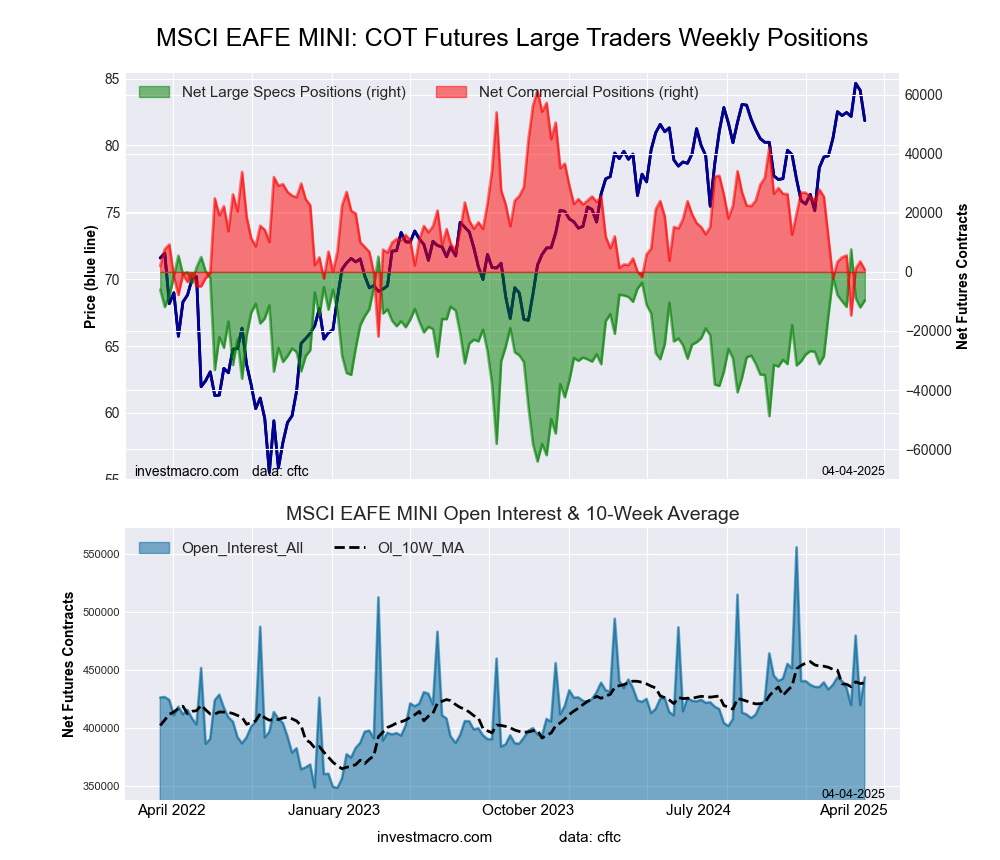 The MSCI EAFE Mini large speculator standing this week equaled a net position of -9,613 contracts in the data reported through Tuesday. This was a weekly gain of 2,410 contracts from the previous week which had a total of -12,023 net contracts.
This week’s current strength score (the trader positioning range over the past three years, measured from 0 to 100) shows the speculators are currently Bullish with a score of 76.0 percent. The commercials are Bearish with a score of 27.1 percent and the small traders (not shown in chart) are Bullish with a score of 61.3 percent.
Price Trend-Following Model: Weak Uptrend
Our weekly trend-following model classifies the current market price position as: Weak Uptrend.
| MSCI EAFE Mini Futures Statistics | SPECULATORS | COMMERCIALS | SMALL TRADERS |
| – Percent of Open Interest Longs: | 11.2 | 85.6 | 2.9 |
| – Percent of Open Interest Shorts: | 13.4 | 85.5 | 0.9 |
| – Net Position: | -9,613 | 721 | 8,892 |
| – Gross Longs: | 49,736 | 380,093 | 12,869 |
| – Gross Shorts: | 59,349 | 379,372 | 3,977 |
| – Long to Short Ratio: | 0.8 to 1 | 1.0 to 1 | 3.2 to 1 |
| NET POSITION TREND: | |||
| – Strength Index Score (3 Year Range Pct): | 76.0 | 27.1 | 61.3 |
| – Strength Index Reading (3 Year Range): | Bullish | Bearish | Bullish |
| NET POSITION MOVEMENT INDEX: | |||
| – 6-Week Change in Strength Index: | -2.4 | -3.3 | 22.3 |
Article By InvestMacro – Receive our weekly COT Newsletter
*COT Report: The COT data, released weekly to the public each Friday, is updated through the most recent Tuesday (data is 3 days old) and shows a quick view of how large speculators or non-commercials (for-profit traders) were positioned in the futures markets.
The CFTC categorizes trader positions according to commercial hedgers (traders who use futures contracts for hedging as part of the business), non-commercials (large traders who speculate to realize trading profits) and nonreportable traders (usually small traders/speculators) as well as their open interest (contracts open in the market at time of reporting). See CFTC criteria here.

- COT Stock Market Charts: Speculator Bets led by S&P500 & Nasdaq Apr 5, 2025
- Today, investors focus on the Non-Farm Payrolls labor market report Apr 4, 2025
- USD/JPY collapses to a 6-month low: safe-haven assets in demand Apr 4, 2025
- GBP/USD Hits 21-Week High: The Pound Outperforms Its Peers Apr 3, 2025
- Most of the tariffs imposed by the Trump administration take effect today Apr 2, 2025
- EUR/USD Declines as Markets Await Signals of a Renewed Trade War Apr 2, 2025
- “Liberation Day”: How markets might react to Trump’s April 2nd tariff announcement? Apr 2, 2025
- The RBA expectedly kept interest rates unchanged. Oil rose to a one-month high Apr 1, 2025
- World stock indices sell off under the weight of new tariffs Mar 31, 2025
- COT Metals Charts: Speculator Bets led by Copper & Palladium Mar 30, 2025


