TradingView is introducing BBTrend, an indicator created by John Bollinger, the originator of Bollinger Bands.
In addition to introducing this new indicator, TradingView has also revised its existing Bollinger Bands indicators under Mr Bollinger’s direct oversight. This process ensured that both the new and updated tools adhere to his precise standards. The collaboration focused on seamlessly integrating these enhancements into TradingView, enriching the platform with John’s expert influence and maintaining the integrity of his analytical methods.
Bollinger Bands are essential tools in technical analysis, primarily used to measure market volatility. These bands consist of a middle line, typically a simple moving average, flanked by two outer bands representing standard deviations from the average. This configuration helps traders identify potential price targets and detect overbought or oversold conditions.
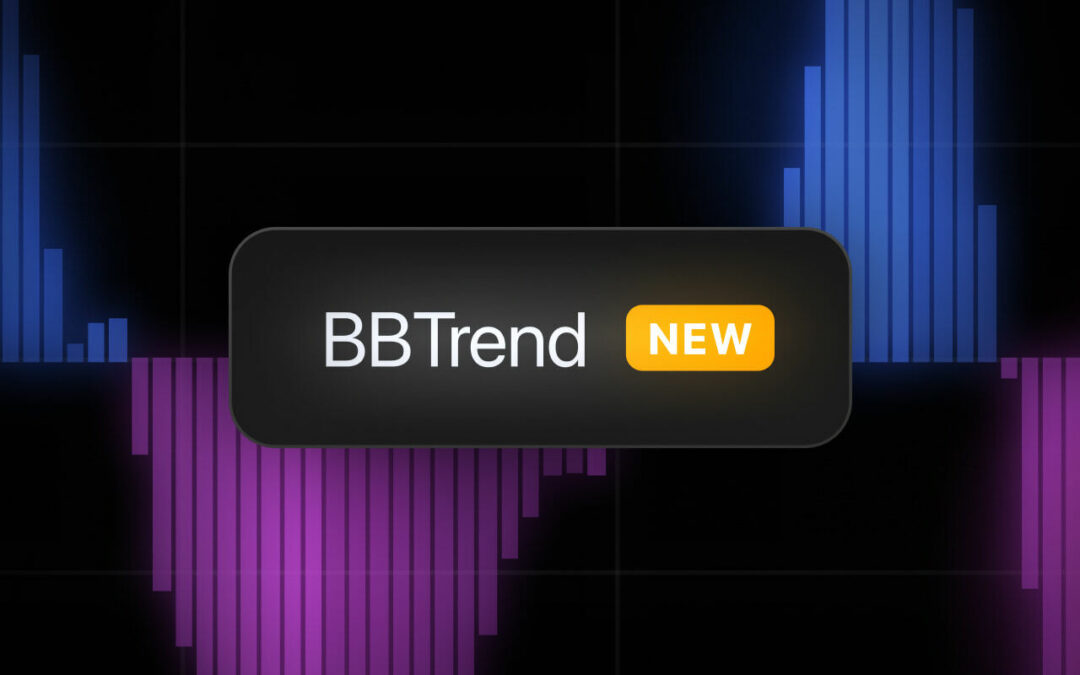
BBTrend advances traditional Bollinger Bands by providing a clearer view of market trends. It analyzes two separate sets of Bollinger Bands — one short and one long — and displays the results in a histogram format. Values above zero indicate a bullish trend, while values below zero signify bearish conditions. The distance from zero reflects the strength of the trend.
Incorporating BBTrend into your trading strategy is straightforward.
- Customize the settings: Adjust the lengths of the short and long Bollinger Bands in the BBTrend settings to match your trading preferences and the specific market dynamics you are analyzing.
- Read the histogram: Monitor the histogram to determine the market trend direction. Positive values indicate a bullish trend, while negative values suggest a bearish trend.
- Assess the trend strength: Evaluate the trend’s strength by observing the distance of the histogram bars from the zero line. The further the bars extend from zero, the stronger the trend.
- Identify potential trend reversals: Pay close attention to the peaks and troughs of the histogram. Peaks can signal potential trend highs, whereas troughs may indicate potential trend lows.
- Observe color intensity: Note changes in the color intensity of the histogram bars, as these can indicate shifts in momentum. More intense colors suggest increasing strength, while lighter colors indicate a weakening trend.
BBTrend is designed to provide traders with detailed insights into market trends, reinforcing TradingView’s commitment to offering advanced analytical tools.


