Continuing its work with John Bollinger, TradingView is introducing Bollinger Bars — a fresh approach to charting that transforms candle bars.
In John Bollinger’s own words, it represents an “exclusive marriage of western bars and candlesticks encoded in color”, adding a new layer of clarity to price action.
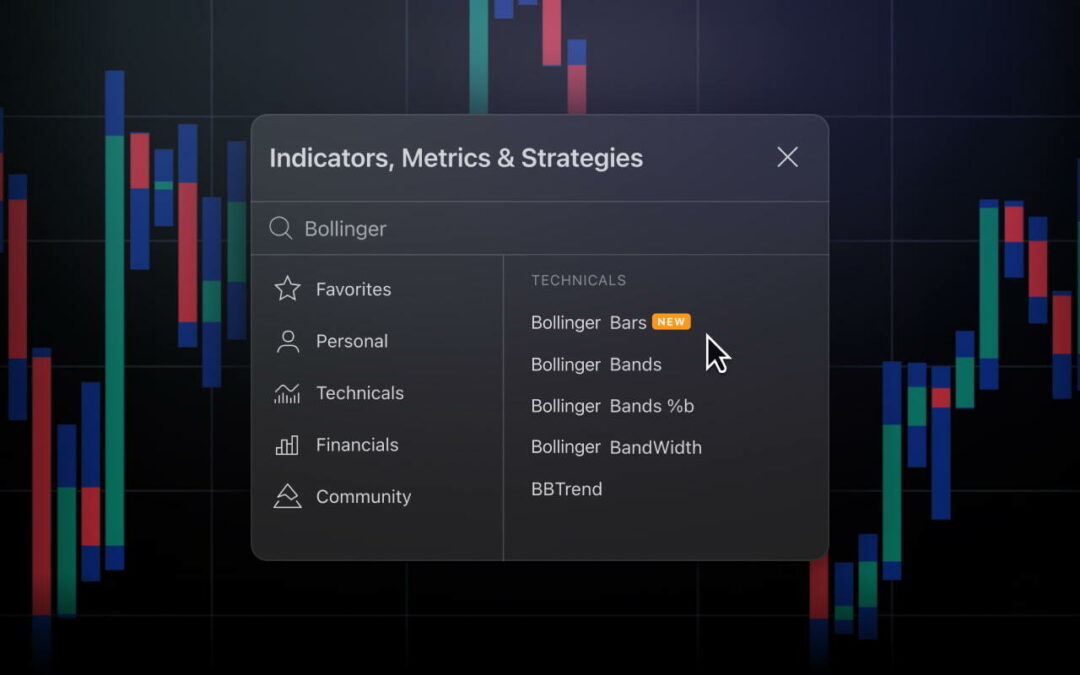
The key advantage of Bollinger Bars is to visually emphasize the full range of prices traded during the time period of a bar. The thin tails of traditional candlesticks deemphasize price action that takes place outside the range between the open and close (the body of the candlestick).
Bollinger Bars maintain the same width from top to bottom, using color to delimit the different areas of the bar. Blue is used for the tails while the area between the open and close is green when the close is above the open or red when the close is below the open. This helps draw the eyes of the analyst to accumulation/distribution trends, periods of compression, and large range days that might contain important information for decision making.
Bollinger Bars are designed to complement other Bollinger tools, creating a comprehensive analysis system recommended by John Bollinger himself.
You can find Bollinger Bars in the Indicator list (press ‘/’ while on Superchart). TradingView recommends using it on charts with candle bars and volume candle bars for optimal insights.


