Shares of Uber Technologies Inc. extended their pullback Wednesday, after they were downgraded just days after the appearance of an ominous “bearish engulfing” chart pattern.
Analyst Robert Mollins cut his rating on the stock to a rare hold, after being at buy for at least the past 2 1/2 years. Mollins is now one of a small minority of the 51 analysts surveyed by FactSet who aren’t bullish on the ride-hailing giant’s stock. (See chart below.)
The stock
UBER,
fell 0.5% in midday trading. It has lost 1.7% since it closed Friday at a record $65.11.
One reason Mollins gave for no longer recommending investors buy is that he believes the bullish catalysts, which include the international expansion of the Uber One subscription plan, growth of its profitable ads business and expectations of capital returns to shareholders, have already been priced into the stock.
The stock, which closed at a record on Monday, has soared 44.8% over the past three months, while shares of rival Lyft Inc.
LYFT,
have rallied 22.8% and the S&P 500 index
SPX
has advanced 15.2%.
Mollins also worries that current Wall Street estimates of underlying profitability are too high, and he sees risks that other cities will follow New York and Seattle in establishing higher mandated wages for app-based delivery workers.
Coincidentally, Mollins’ downgrade comes two days after a “bearish engulfing” candlestick chart pattern appeared to warn that the stock’s 19-month uptrend was in trouble.
A “bearish engulfing” is a two-day reversal pattern. For the first part on Friday, the stock opened at $64.90 and closed at a record $65.39, while trading within an intraday range of $64.41 to $65.39.
“Bullish engulfing” trend reversal patterns appears Monday after Friday’s record close.
FactSet, MarketWatch
The second part was Monday. The stock opened at a new all-time high of $65.44, traded even higher to $65.61, then pulled a sharp U-turn to hit an intraday low of $64.15 before closing down 0.9% at $64.55, which was below where the stock opened on Friday.
The pattern suggests that Friday, and Monday’s open, marked a buying climax. If bulls still had the momentum, bears wouldn’t have been able to launch such a successful counterattack.
Don’t miss: 7 key candlestick reversal patterns.
Similar to another technical price chart pattern known as a “key reversal,” “bearish engulfings” warn that the previous trend may have ended. For Uber, that previous trend took the stock up 218%, from a two-year low of $20.46 on June 30, 2022 to Friday’s record close.
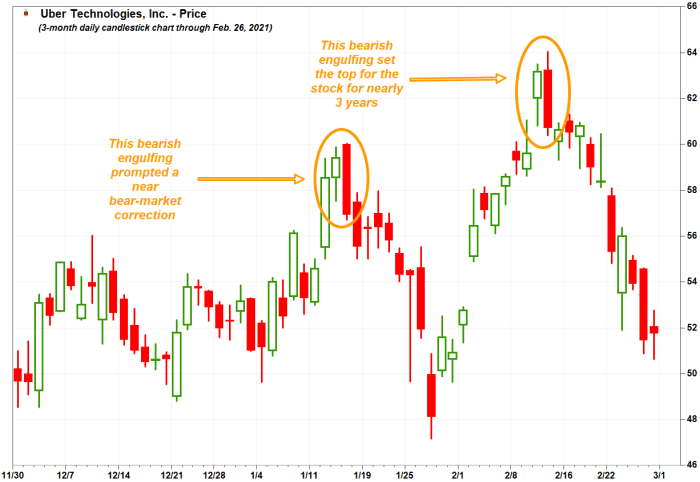
Uber’s previous record close in February 2021 was marked by a bearish engulfing.
FactSet, MarketWatch
There is a precedent for investors to heed the reversal pattern’s warning. The 16-month downtrend that ended in June 2022 was kicked off with a “bearish engulfing” pattern on Feb. 11, 2021, the day after it closed at a record of $63.18.
And another that appeared on Jan. 14, 2021, led to a 19% correction before bottoming.
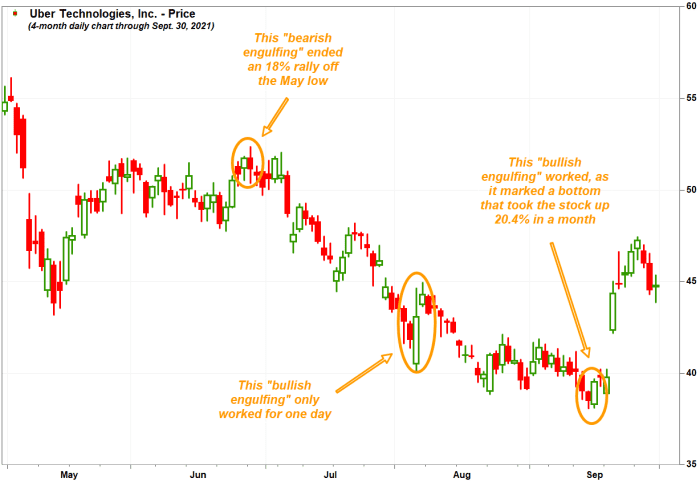
Not all “engulfing” patterns worked.
FactSet, MarketWatch
Of course, like the chart above shows, there have been “engulfing” patterns like those that didn’t work.
Most analysts are bullish on Uber’s stock, but not by much on average
As noted above, the vast majority of Wall Street analysts are bullish on Uber’s stock.
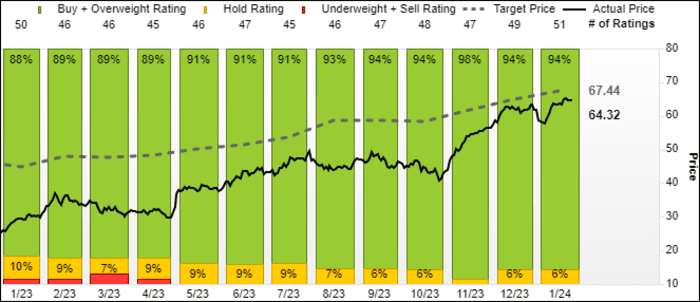
FactSet
Interestingly, the average stock price target of the 51 analysts surveyed is $67.44, which implies just 5.4% upside from current prices.
To put that upside potential in perspective, Mollins raised his price target to $66 from $64, but still downgraded the stock because his new target implied just 3.2% upside from current levels.
For Gordon Haskett, stocks with buy ratings are expected to outperform the broader market by more than 10% on a total return basis.

