The price of bitcoin has continued its search to the upside reaching a new high going back to November 2021 of $60,765. The price is now up all her 57% from the low price for 2024 reached during the week of January 22. Since the week of September 11, 2023 the price is up 143.45%. Since the first week of January 2023 the price is up 266.52%.
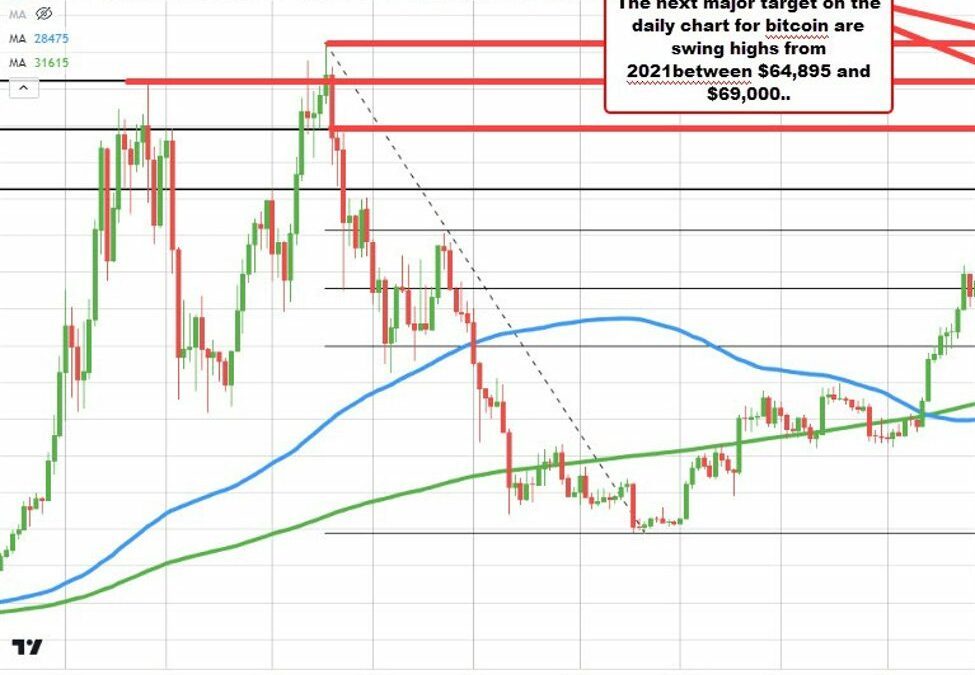
The swing high going back to April 21 reached up to $64,895. That is a target on a daily chart. Above that and traders would look toward the November 2021 high price which hit near $69,000.
Drilling to the 5-minute chart, it would take a move below the $60000 and the $59517 level to hurt the short term bias.
Looking at the 5-minute chart below, the rising 100 bar MA (blue line in the chart below) is at $58,913 and moving higher. Getting below that level and staying below that level is now required to give the sellers some control. Absent that, and they are not winning/the buyers are winning….
Although the price dipped below the 200-bar moving average and the 100 bar moving average briefly, momentum cannot be sustained, and the price ultimately based against both those moving averages before starting its run to the upside (see the chart below).
Bitcoin based against its 100/200 bar moving averages
Also moving higher is Ethereum which is testing its 61.8% retracement of the move down from the 2021 high. A level comes in at $3388.80. The high price today reached $3371 just short of that level. Move above that level, and traders will target the April 2022 high at at $3580.90.
The price is up 59.17% from the 2024 low, and 181.16% from the beginning of January 2023.


