Lesson 6: Type of Candles
Each candle has its own story and, of course, its meaning. Recognizing the type of candle is very important as it indicates the intentions of the market. It does not matter to know the names of each type, but it is good to understand their meaning. Let’s start.
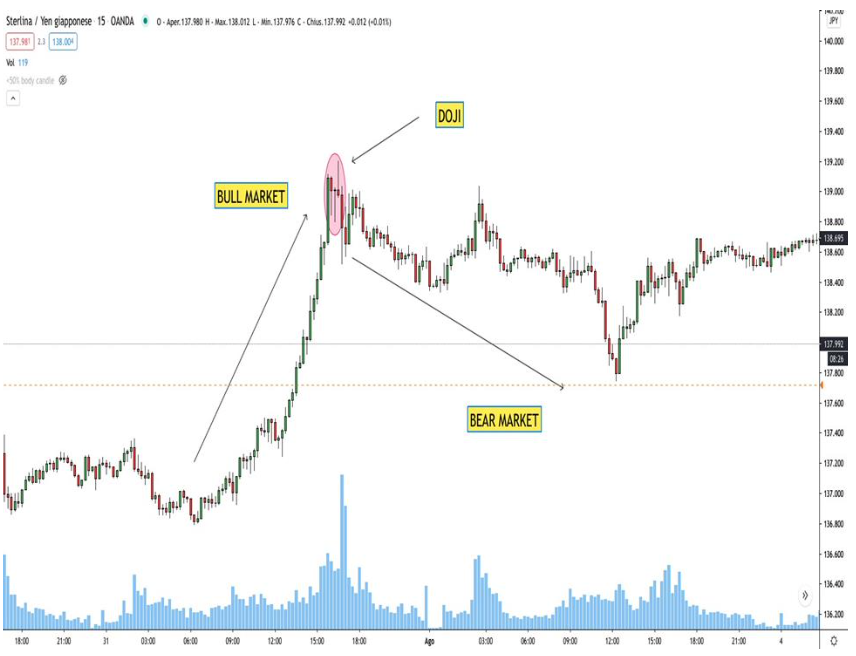
• DOJI: As you can see, DOJI candles are famous for not having a body. It is characterized by two long shadows, the lower one and the upper one and a body whose closing and opening points are very close, if not the same. The four types of DOJI candles are shown in the image below. The DOJI is an essential candle as it indicates that the market is undecided; neither the buyers nor the sellers have the upper hand. They are considered candles of indecision.
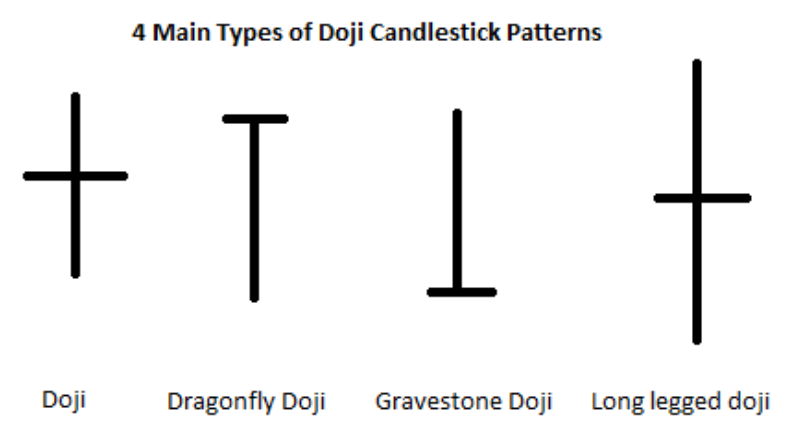
Attention: A DOJI candle does not necessarily indicate a change in the trend; to be safer, wait for confirmation with the next candle. In the graph below, the DOJI is followed by another red candle that indicates descent; here is our confirmation!
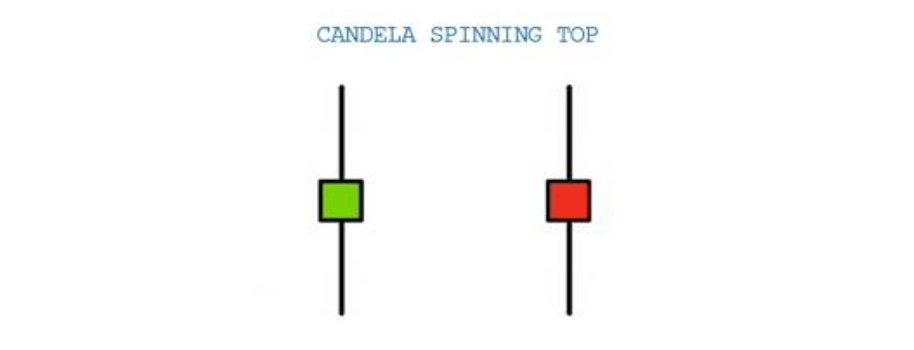
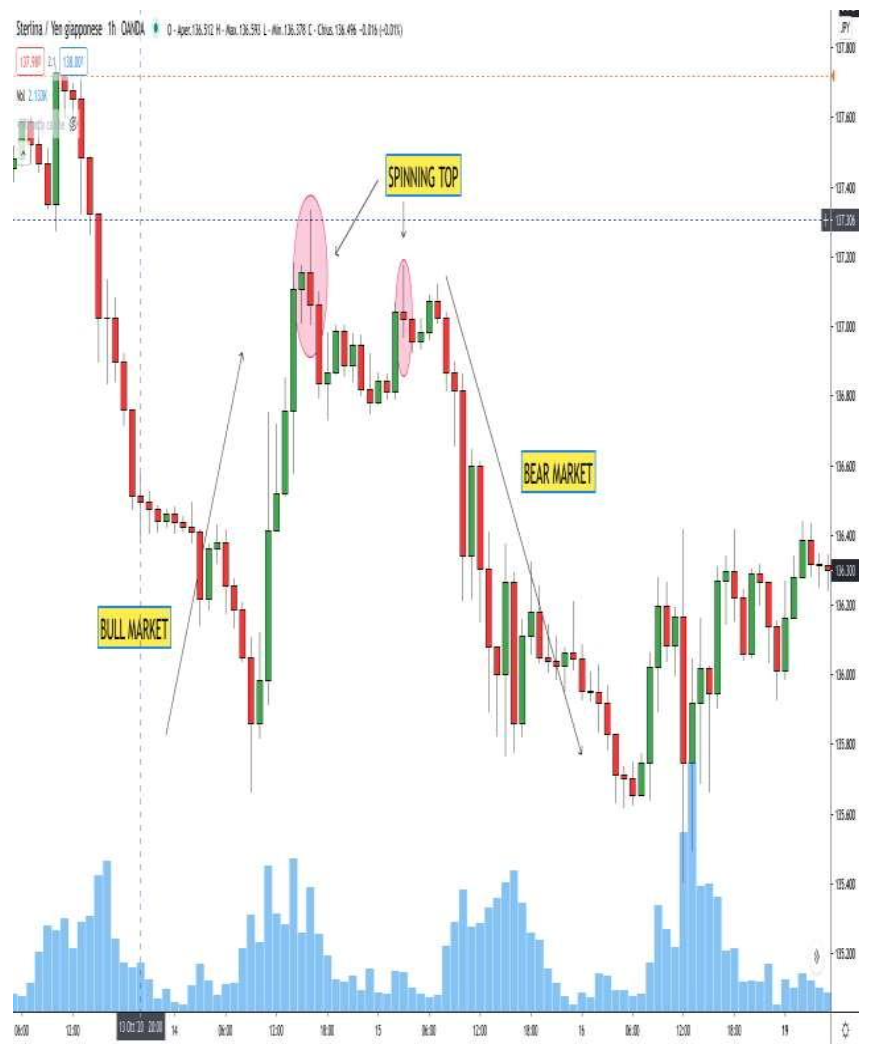
• SPINNING TOP: The Spinning Top is another candle that indicates indecision. It is characterized by two long shadows and a smaller body; also, in this case, it is found at the end of a trend.
• THE HANGING MAN: The Hanging Man is a candle that, if red, indicates a Bull market. It consists of a body and a very long lower shadow. It occurs after an ascending trend, suggesting it is time to bet on the descent. A red body forms it, and its shadow is directed towards the new market trend, the downward one. On the contrary, if you find it after a downward trend, it is time to buy, but the shadow will be turned upwards. It can be considered a candle of indecision. Be aware that it is a candle with a completely different meaning from “hammer”!
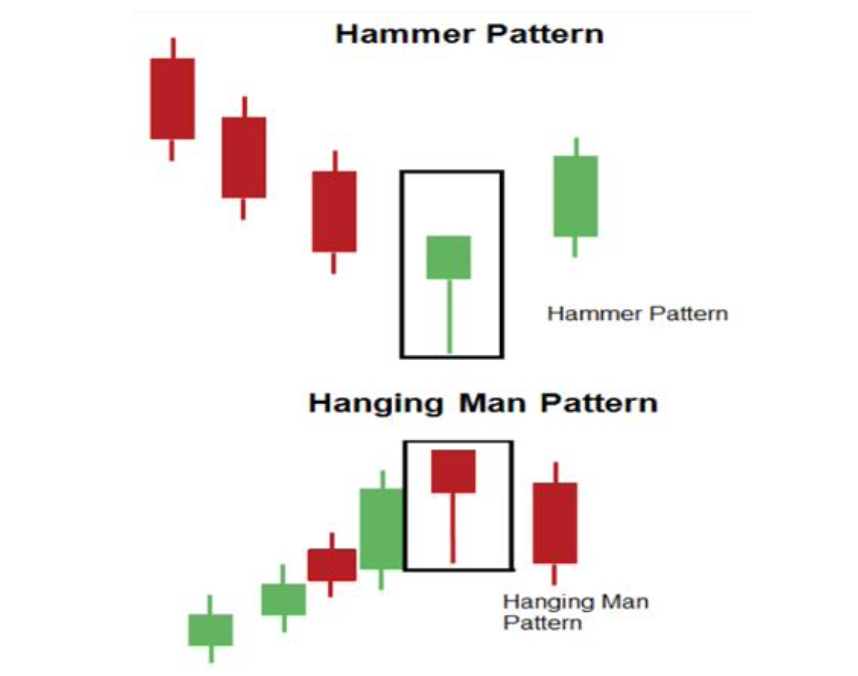
- THE HAMMER: “The Hammer” and “The Hanging Man” have the same shape but opposite meanings.
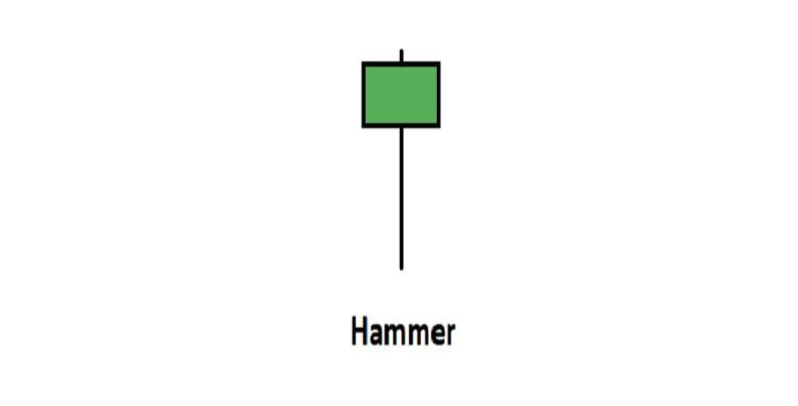
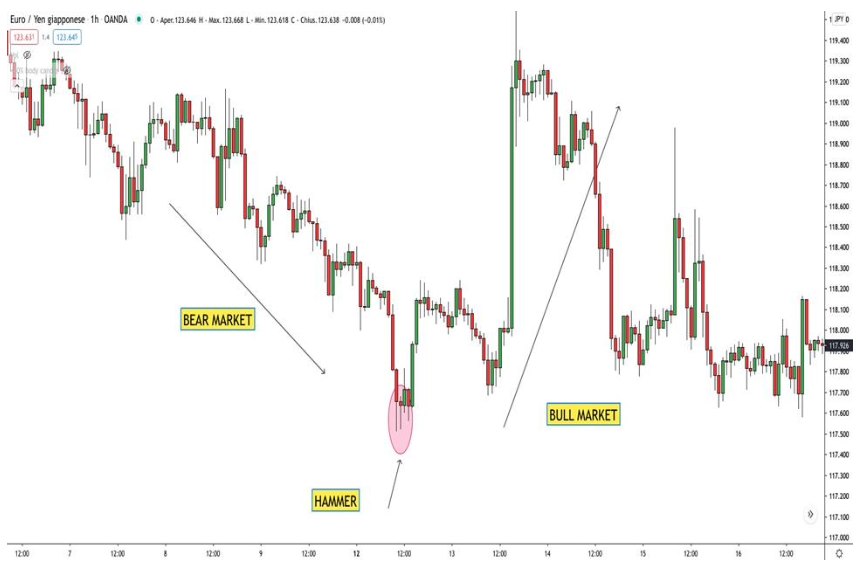
Unlike the Hanging Man, the Hammer indicates an upward trend and is found at the end of the downward trend. Its shadow is not directed towards the new trend but towards the bottom. It can be considered a candle of indecision. Remember to always wait for a confirmation before entering!
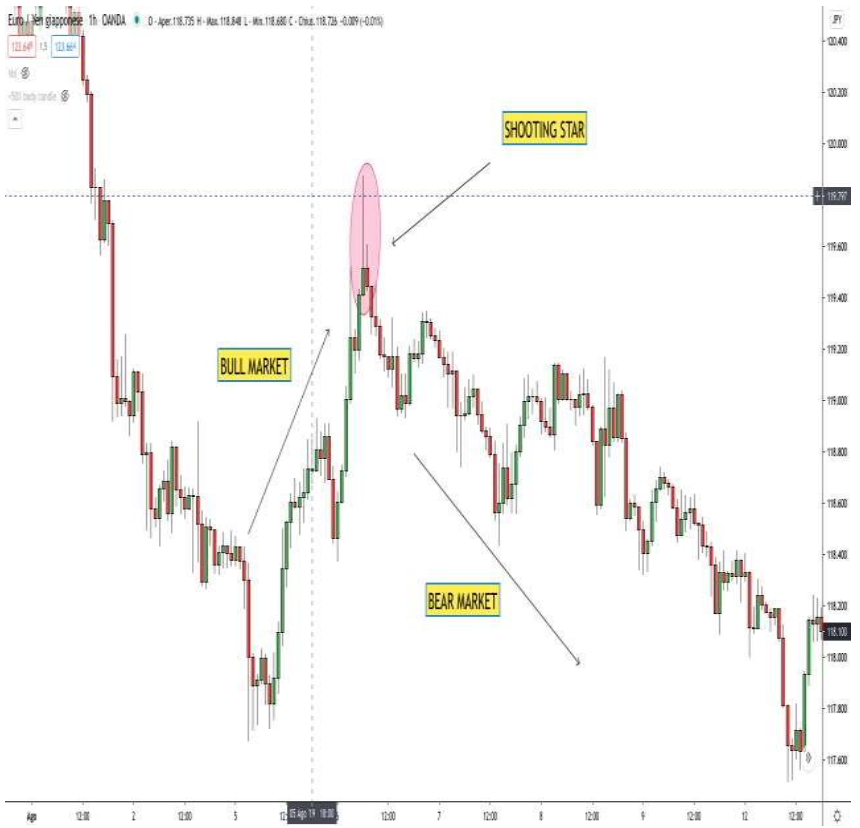
- SHOOTING STAR: The Shooting Star candle indicates descent; it has the same function as the Hanging Man, but its shadow faces upwards. We can define it as the opposite of the Hammer with the functionality of the Hanging Man. A body and a huge upper shadow form it. We find it at the end of an ascending trend. It can be considered a candle of indecision.
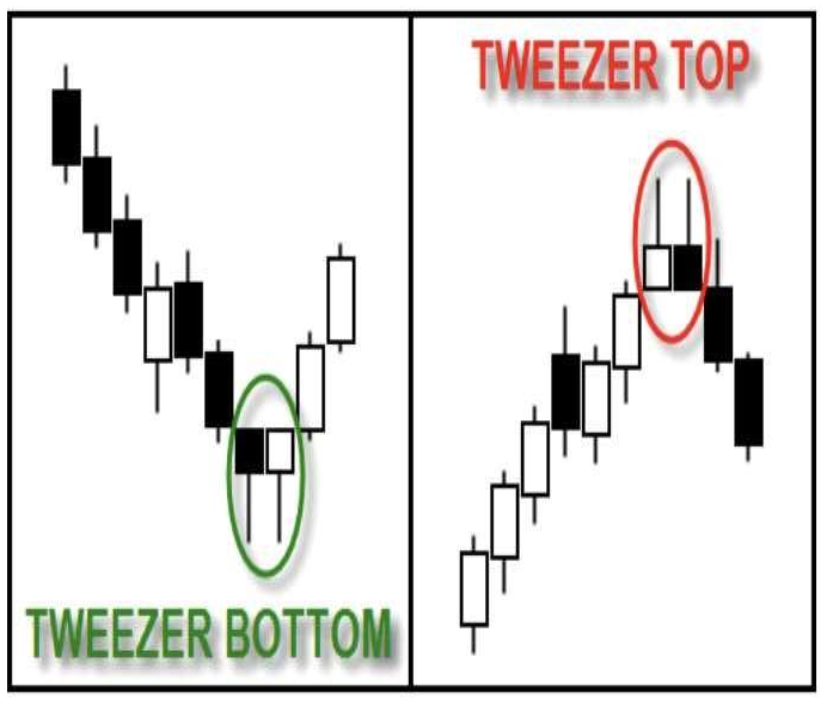
- TWEEZER TOPS AND BOTTOMS: The Tweezer tops and bottoms are two patterns formed by two candles. This combination is found after a large upward or downward movement. The two candles are very similar, have the same body size and very similar shadows. It’s a very strong pattern but not super easy to find. It indicates market trend reversal; please always wait for confirmation with the next candle.
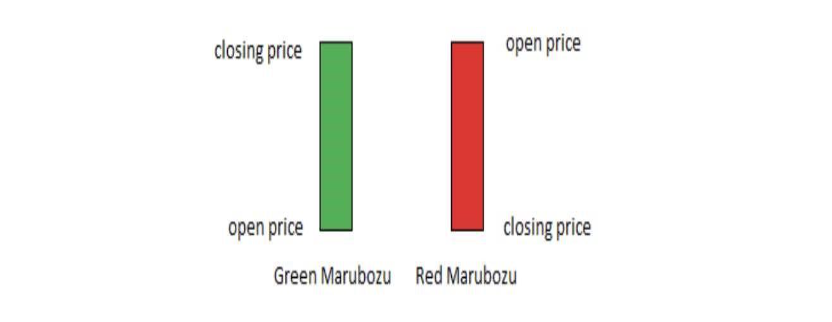
- MARUBOZU: The Marubozu Candle is the strongest candle of all. It indicates that buyers or sellers are in the complete majority, and the trend will continue in their favour. This type of candle has only the body; the shadows are absent. It is essential to know that this candle has value with a high time frame, 1h / 4h / 1D. This candle indicates a continuation of the trend; if the Marubozu candle shows an ascending trend, it is time to buy; if the candle is red, it shows a descending trend. The higher the time frame, the more valid the candle will be.
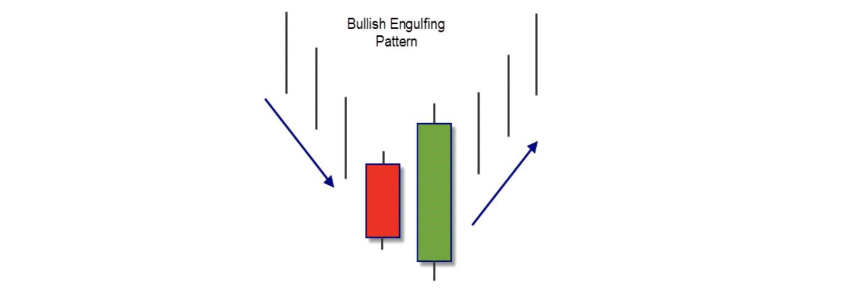
- BULLISH ENGULFING PATTERN: The Bullish Engulfing Pattern occurs at the end of a downtrend at the support level; in the next chapter, I will explain what it is. One last red candle will be covered entirely with a green candle. This pattern indicates a change in the direction of the graph. Please, a confirmation is required after the Engulfing candle.
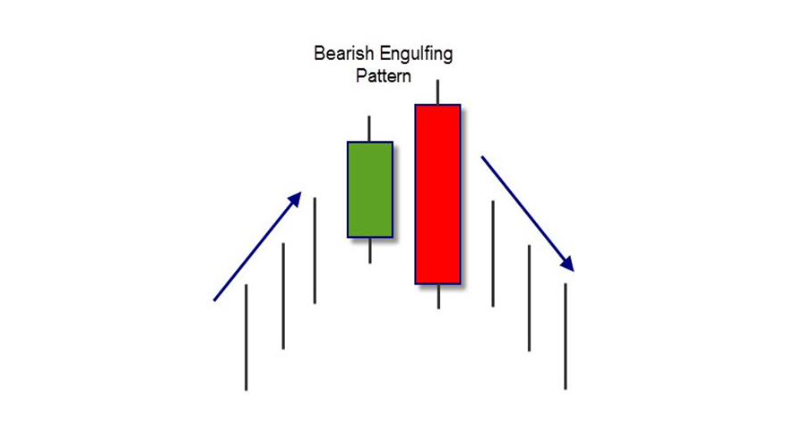
- BEARISH ENGULFING PATTERN: The Bearish Engulfing Pattern can be considered the opposite of the Bullish Engulfing Pattern. We find it after an ascending trend, which means the change of direction of the movement from bull to bear. This pattern is also formed by a red candle covering the last green candle.
- THE MORNING STAR: This pattern is made up of three candles. We find it at the end of a descending trend, indicating a rise in the trend. It comprises a last bearish candle, a DOJI and a green candle that covers 50% -70% of the first candle.
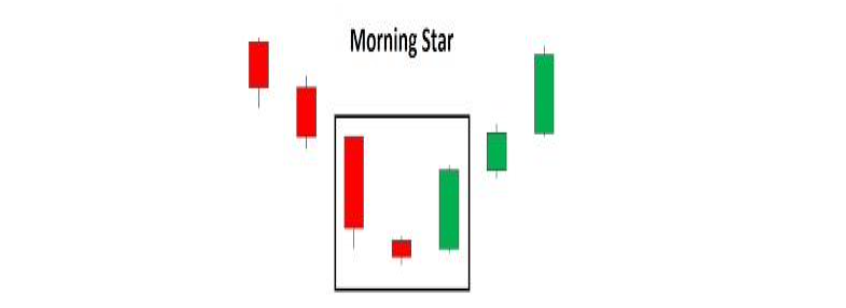
As we can see, after the formation of the pattern, it is necessary to wait for a confirmation before entering the market with a “buy”. Don’t rush.
- THE EVENING STAR: This pattern is the opposite of the Morning Star. It is also made up of three candles, but we no longer find it in a descending trend but in an ascending one. The pattern is formed by a green candle, a DOJI and a red candle covering 50% -70% of the first.
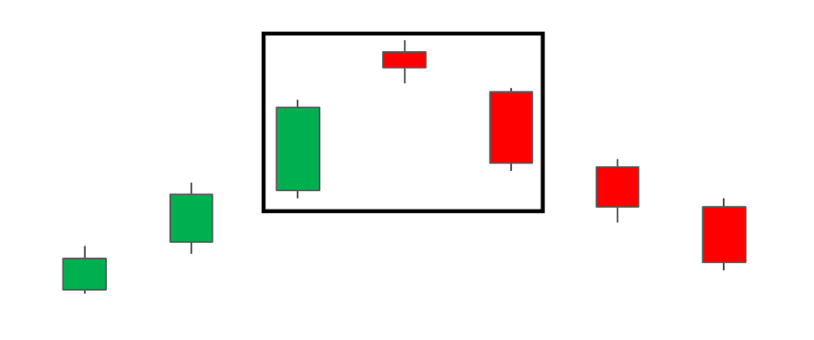
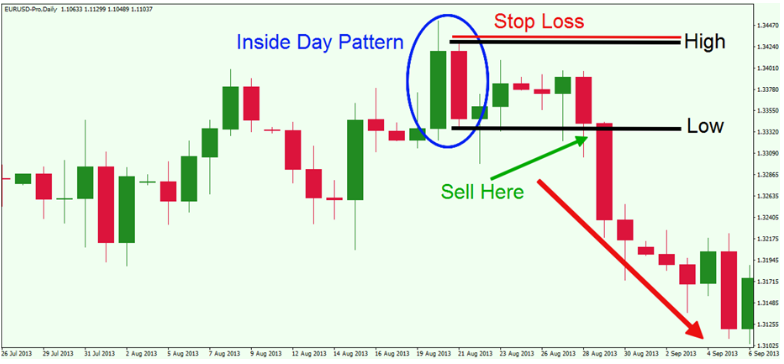
- THE INSIDE CANDLESTICK FORMATION: This pattern is very easy to find. It is formed by a mother candle that incorporates the next candles. It is elementary as a pattern because when the mother candle is broken, it will follow the trend.
Congratulations! Now you know all the possible candlestick patterns, it’s time to take the first steps!
Trading Lessons:
Lesson 1: Quick Introduction
Lesson 1: Introduction "The secret to being successful from a trading perspective is to have an indefinite and tireless thirst for information and knowledge." Paul Tudor Jones Forex trading, the abbreviation for "Foreign Exchange Market", occurs when one...
Lesson 2: Trading Timetable
Lesson 2: Trading Timetable The Forex market is open 5 days a week 24 hours a day, but it is divided into 4 different sessions: • Sydney • Tokyo • London • New York Each session has a different opening and closing time. Attention: In summer and winter the...
Lesson 3: How to Invest in Trading
Lesson 3: How to Invest in Trading 85% of traders lose their money. How is it possible? There is nothing more important than investing in yourself. To become a professional trader, you must face many needs and fears. A winning strategy is necessary, notions of...
Lesson 4: Fundamental Notions
Lesson 4: Fundamental Notions The market can make three movements: Bull Market: if the trend rises, the currency gains value. Bear Market: if the trend falls, the currency loses value. Horizontal Trend (Kangaroo Market): the price moves continuously,...
Lesson 5: Types of Charts
Lesson 5: Type of Graphs Every day, we see stock market charts on the TV news. They are often "line" charts, but there are many other ways to read them. The most used are "lines", "candles", and "bars" charts. Let's find them out!Guess what? The graph with which...
Lesson 7: Support and Resistance
Lesson 7: Support and Resistance Supports and resistances are levels where the price has a great chance to bounce. We will notice how the price will bounce several times on the same level before continuing its rise or fall. Supports: Levels at which the price is...
Lesson 8: TrendIines and Patterns
Lesson 8: Trendlines and Patterns In trading, there are not only supports and resistances, but other patterns must be considered very important. Price often forms channels in which the trend bounces. You must recognize them to be prepared to enter the market....
Lesson 9: Market Movement
Trading Course Introduction The market goes through three different moments, which is good to know. In both bearish and bullish momentum, the market will go through 3 various movements:• Distribution• Re-Distribution• Accumulation•...
Lesson 10: Types of Trend
Lesson 10: Types of Trend Let’s start with the definition of “Momentum”. Momentum refers to the general trend of the graph. As we have already studied, the market can be in a Bearish, Bullish or Kangaroo phase. Now, we need to look at how the trend moves in...
Lesson 11: Supply and Demand
Lesson 11: Supply and Demand As I mentioned at the beginning, I am a Scalper, and consequently, I am satisfied with a small slice of the trend, from 10 to 20 PIPS. Don't think that with 20 Pips, you can earn less than with 100; trading is based on percentages....
Lesson 12: Fibonacci Retracement
Trading Course Introduction Many of you may have heard about Fibonacci Retracement but don't know how to use it. Let's start with a basic definition: Fibonacci Retracement is a key technical analysis tool that uses percentages and horizontal lines drawn on price...
Lesson 13: Indicators
Lesson 13: Indicators Forget the indicators; most are useless, and they only dirty the graph. Remember that we work with clean charts; we follow the trend. Many Forex Gurus will advise you to use indicators on indicators, but in these chapters, you will find...
Lesson 14: Market Manipulation
Lesson 14 Market Manipulation Many of you have already heard of the Fake Out; the Fake Out can be considered a market manipulation that serves to deceive traders. It happens after a long series of ascending or descending markets; the price breaks the support or...
Lesson 15: Plan and Risk Management
Lesson 15: Plan and Risk Management Many people approach the world of trading fascinated by simple money, but trading is a whole other world; as you can already understand, it is 90% patience and 10% the correct analysis. Anyone who believes in easy money will...
Lesson 16: Simple Trading Strategy
Lesson 16: Simple Trading Strategy I begin by saying that this strategy worked for me initially, and it’s not sure it will work for all of you. Each one will improve over time, and you will understand the best strategy suitable for yourself.As you can see, we...
Lesson 17: Psychology
Lesson 17: Psychology I’m the greatest. I said that even before I knew that I was -Muhammad Ali Reread this chapter whenever you fail and think you can't do it. I'm sorry to tell you that you will keep losing and burning accounts without the proper psychology,...
Lesson 18: Suggestions
Lesson 18: Suggestions Brokers: ICMARKETS: It is by far the best. Remember to open an ECN / RAW account if you are a Scalper. This will have a commission instead of the spread. As a scalper, I am also happy with 7 Pips. Certainly, I don't want to earn to give...


