By InvestMacro
The latest update for the weekly Commitment of Traders (COT) report was released by the Commodity Futures Trading Commission (CFTC) on Friday for data ending on December 19th.
This weekly Extreme Positions report highlights the Most Bullish and Most Bearish Positions for the speculator category. Extreme positioning in these markets can foreshadow strong moves in the underlying market.
To signify an extreme position, we use the Strength Index (also known as the COT Index) of each instrument, a common method of measuring COT data. The Strength Index is simply a comparison of current trader positions against the range of positions over the previous 3 years. We use over 80 percent as extremely bullish and under 20 percent as extremely bearish. (Compare Strength Index scores across all markets in the data table or cot leaders table)
Here Are This Week’s Most Bullish Speculator Positions:
Steel
The Steel speculator position comes in as the most bullish extreme standing this week. The Steel speculator level is currently at a 100.0 percent score of its 3-year range.
The six-week trend for the percent strength score totaled 5.6 this week. The overall net speculator position was a total of 130 net contracts this week with a rise by 615 contract in the weekly speculator bets.
Speculators or Non-Commercials Notes:
Speculators, classified as non-commercial traders by the CFTC, are made up of large commodity funds, hedge funds and other significant for-profit participants. The Specs are generally regarded as trend-followers in their behavior towards price action – net speculator bets and prices tend to go in the same directions. These traders often look to buy when prices are rising and sell when prices are falling. To illustrate this point, many times speculator contracts can be found at their most extremes (bullish or bearish) when prices are also close to their highest or lowest levels.
These extreme levels can be dangerous for the large speculators as the trade is most crowded, there is less trading ammunition still sitting on the sidelines to push the trend further and prices have moved a significant distance. When the trend becomes exhausted, some speculators take profits while others look to also exit positions when prices fail to continue in the same direction. This process usually plays out over many months to years and can ultimately create a reverse effect where prices start to fall and speculators start a process of selling when prices are falling.
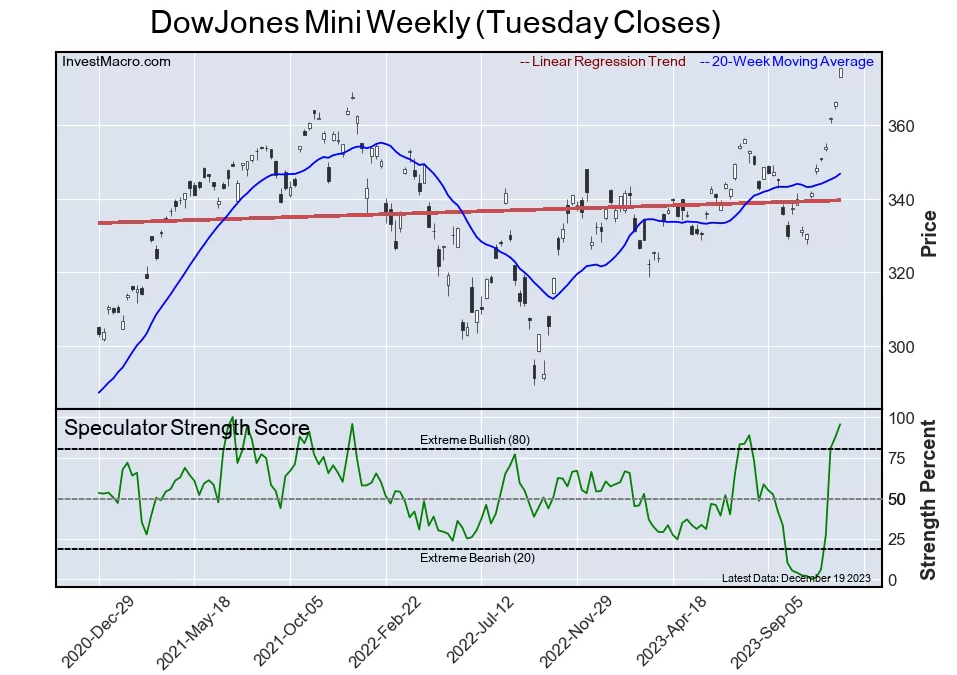
DowJones Mini

The DowJones Mini speculator position comes next in the extreme standings this week. The DowJones Mini speculator level is now at a 95.5 percent score of its 3-year range.
The six-week trend for the percent strength score was 95.5 this week. The speculator position registered 7,123 net contracts this week with a weekly gain of 3,672 contracts in speculator bets.
3-Month Secured Overnight Financing Rate

The 3-Month Secured Overnight Financing Rate speculator position comes in third this week in the extreme standings. The 3-Month Secured Overnight Financing Rate speculator level resides at a 92.5 percent score of its 3-year range.
The six-week trend for the speculator strength score came in at 10.1 this week. The overall speculator position was 577,707 net contracts this week with a drop of -140,519 contracts in the weekly speculator bets.
Brazil Real

The Brazil Real speculator position comes up number four in the extreme standings this week. The Brazil Real speculator level is at a 91.4 percent score of its 3-year range.
The six-week trend for the speculator strength score totaled a change of 22.4 this week. The overall speculator position was 43,832 net contracts this week with a decline of -2,832 contracts in the speculator bets.
Mexican Peso

The Mexican Peso speculator position rounds out the top five in this week’s bullish extreme standings. The Mexican Peso speculator level sits at a 90.4 percent score of its 3-year range. The six-week trend for the speculator strength score was 28.8 this week.
The speculator position was 84,001 net contracts this week with a boost by 9,876 contracts in the weekly speculator bets.
This Week’s Most Bearish Speculator Positions:
Soybeans

The Soybeans speculator position comes in as the most bearish extreme standing this week. The Soybeans speculator level is at a 0.0 percent score of its 3-year range.
The six-week trend for the speculator strength score was -23.8 this week. The overall speculator position was 1,998 net contracts this week with a drop of -15,541 contracts in the speculator bets.
Ultra 10-Year U.S. T-Note

The Ultra 10-Year U.S. T-Note speculator position comes in next for the most bearish extreme standing on the week. The Ultra 10-Year U.S. T-Note speculator level is at a 2.0 percent score of its 3-year range.
The six-week trend for the speculator strength score was -0.2 this week. The speculator position was -265,218 net contracts this week with an increase by 11,258 contracts in the weekly speculator bets.
Corn

The Corn speculator position comes in as third most bearish extreme standing of the week. The Corn speculator level resides at a 4.2 percent score of its 3-year range.
The six-week trend for the speculator strength score was -3.1 this week. The overall speculator position was -127,570 net contracts this week with a decrease of -26,355 contracts in the speculator bets.
5-Year Bond

The 5-Year Bond speculator position comes in as this week’s fourth most bearish extreme standing. The 5-Year Bond speculator level is at a 5.1 percent score of its 3-year range.
The six-week trend for the speculator strength score was 2.2 this week. The speculator position was -1,388,222 net contracts this week with a decline of -48,102 contracts in the weekly speculator bets.
Soybean Oil

Finally, the Soybean Oil speculator position comes in as the fifth most bearish extreme standing for this week. The Soybean Oil speculator level is at a 8.6 percent score of its 3-year range.
The six-week trend for the speculator strength score was -18.2 this week. The speculator position was -16,356 net contracts this week with a decrease of -10,552 contracts in the weekly speculator bets.
Article By InvestMacro – Receive our weekly COT Newsletter
*COT Report: The COT data, released weekly to the public each Friday, is updated through the most recent Tuesday (data is 3 days old) and shows a quick view of how large speculators or non-commercials (for-profit traders) were positioned in the futures markets.
The CFTC categorizes trader positions according to commercial hedgers (traders who use futures contracts for hedging as part of the business), non-commercials (large traders who speculate to realize trading profits) and nonreportable traders (usually small traders/speculators) as well as their open interest (contracts open in the market at time of reporting). See CFTC criteria here.

- Japan sees inflationary pressures easing. Angola leaves OPEC+ Dec 22, 2023
- USDInd breaks down ahead of US inflation data Dec 22, 2023
- Hedge funds and large investors are locking in positions ahead of the Christmas holidays Dec 21, 2023
- Jap225_m squeezed into “symmetrical triangle” Dec 21, 2023
- China kept interest rates at current levels. The conditions for a rally have formed again for oil Dec 20, 2023
- Can Crude break out of downtrend? Dec 20, 2023
- Bank of Japan disappointed investors with no plans for 2024. Oil rises due to Houthi attacks on tankers in the Red Sea Dec 19, 2023
- Investors are expecting a Santa Claus rally. The Eurozone economy is close to a recession Dec 18, 2023
- Trade of the Week: GBPUSD in for an early-Christmas cracker? Dec 18, 2023
- EUR/USD Finds Stability Dec 18, 2023


