TradingView has introduced a new functionality of its screeners that allows traders to analyze data on symbol charts.
Now there are two ways of data display in Stock, ETF, and Crypto coins screeners:
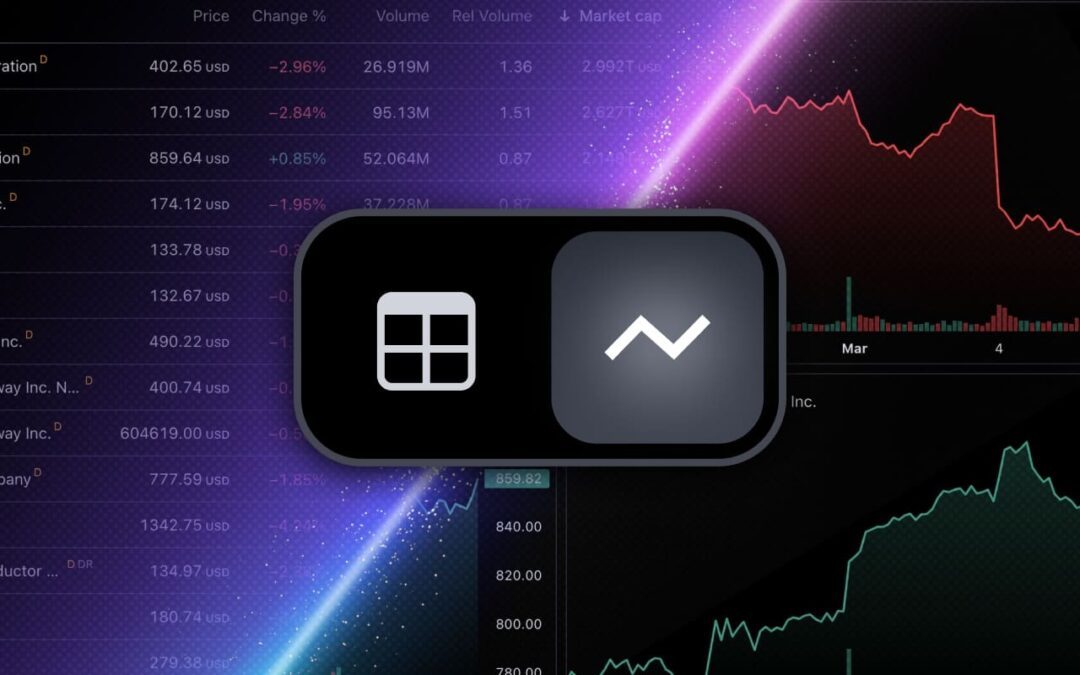
- Table view — data is presented in a table with column sets.
- Chart view — data is presented in charts with price change on the selected interval and trading volume of the instrument.
To switch between these two modes, click on Table view or Chart view in the top left corner of a screener:

By default, Area chart type is selected, but you can also opt for other types: Candles and Line.

It is also worth remembering that each range is associated with a specific timeframe. There are the following range options:
- 1 day — 5-minute timeframe
- 5 days — 15-minute timeframe
- 1 month — 1-hour timeframe
- 3 months — 4-hour timeframe
- 6 months — 1-day timeframe
- YTD — 1-day timeframe
- 1 year — 1-week timeframe
- 5 years — 1-month timeframe
- All data — 1-month timeframe
On smaller screens date range is selected in a drop-down menu. For example, if you select a 1-year range, each bar will equal one week.
With Chart view on, you can apply all available filters and select the necessary market.


